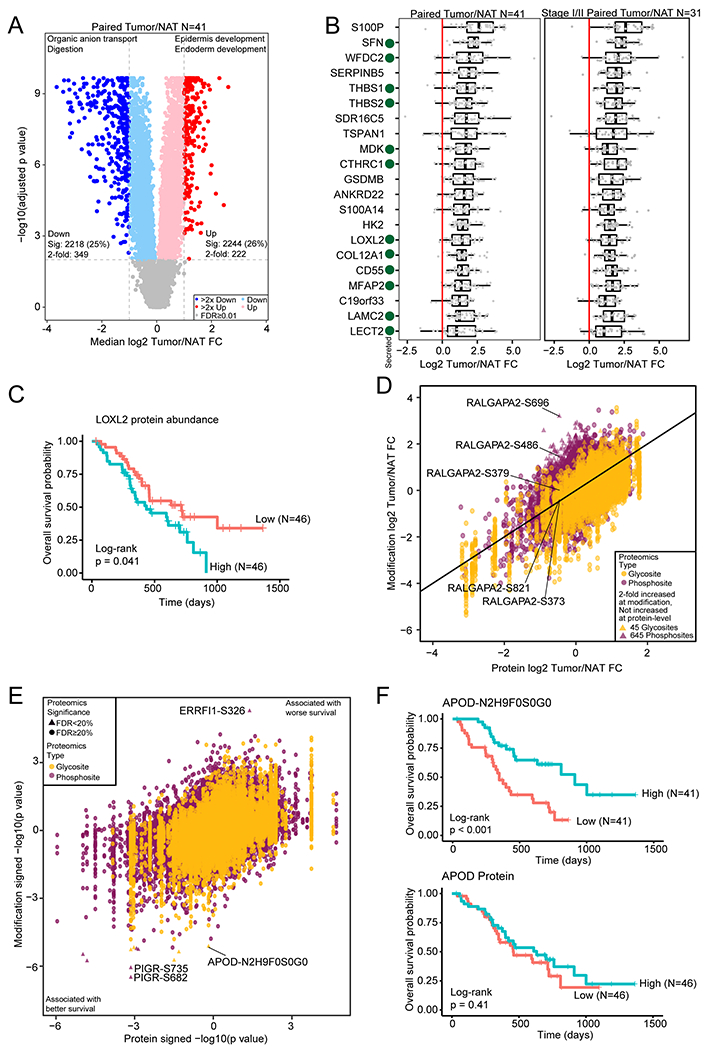
Figure 3. Identification of tumor-associated proteins and modification sites by comparison of tumor and normal tissues.

A) Differential protein abundance between tumors and paired NATs. Selected GO biological process terms for significantly increased and significantly decreased proteins are shown above the volcano plot. B) Proteins with a median fold change > 2 compared to matched NAT and with significantly increased abundance both compared to normal ductal tissues and after adjusting for epithelial content for all samples and the subset of stage I/II samples. Secreted proteins are indicated with a green dot. C) Kaplan-Meier curve for LOXL2 protein abundance association with overall survival. The two groups were separated by median LOXL2 abundance. D) Median phosphosite and N-linked glycosylation site fold change compared to the protein fold change in tumor compared to matched NAT. E) Cox regression signed p value for phosphosite and N-linked glycosylation site abundance association with survival compared to the protein association to survival. F) Kaplan-Meier survival curves for an N-linked glycosylation site on APOD and APOD protein abundance.
