
Figure 4. Glycoproteomic characterization identified N-linked glycoproteins and glycosylation enzymes for the early detection or therapeutic intervention.
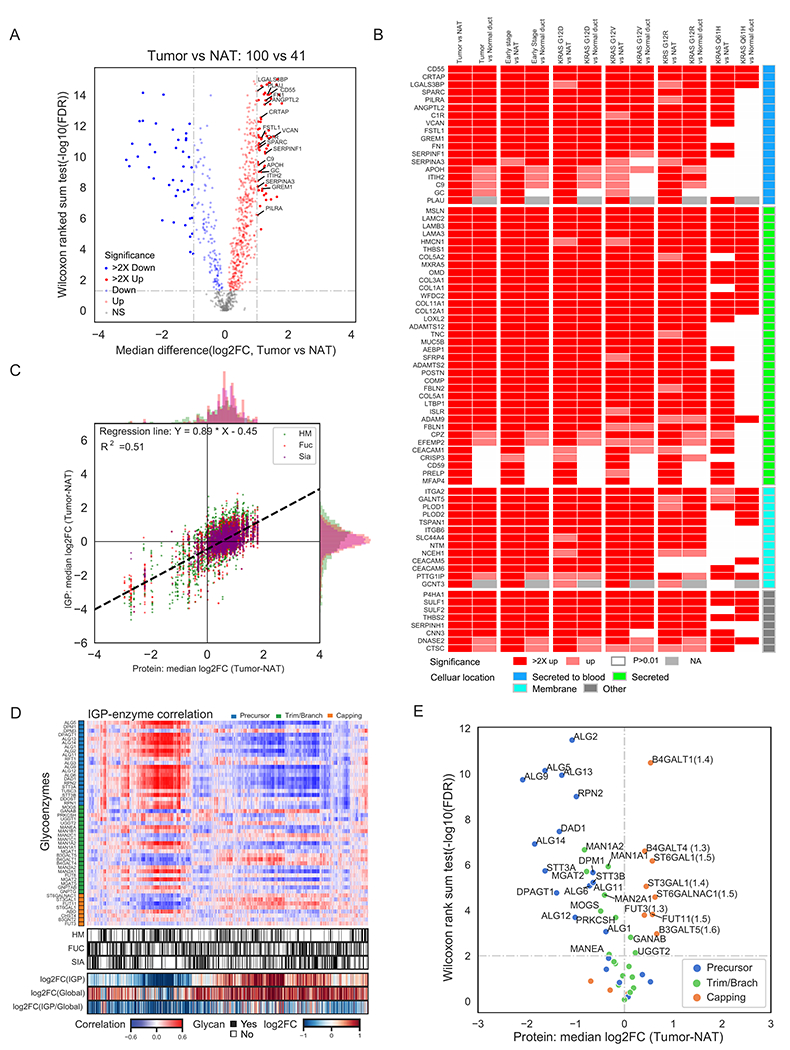
A) Differential expression analysis of N-linked glycoproteins in tumors to identify the most significant secreted (highlighted) and membrane N-linked glycoproteins elevated in tumors compared to NATs. B) Up-regulation of N-linked glycoproteins in all tumors, early stage tumors or tumors with different hotspot KRAS mutations relative to NATs and normal ductal tissues (Normal duct) at N-linked glycoprotein expression levels. C) Comparative analysis of the expression of global proteomics and glycoproteomics. IGP: intact glycopeptides; HM: high mannose type glycopeptides; Fuc: fucosylated glycopeptides; Sia: sialylated glycopeptides. D) Association of intact glycopeptide abundance and protein levels of glycosylation enzymes in tumors and NATs. E) Differential protein expression of N-linked glycosylation enzymes between tumors and NATs.