
Figure 1.
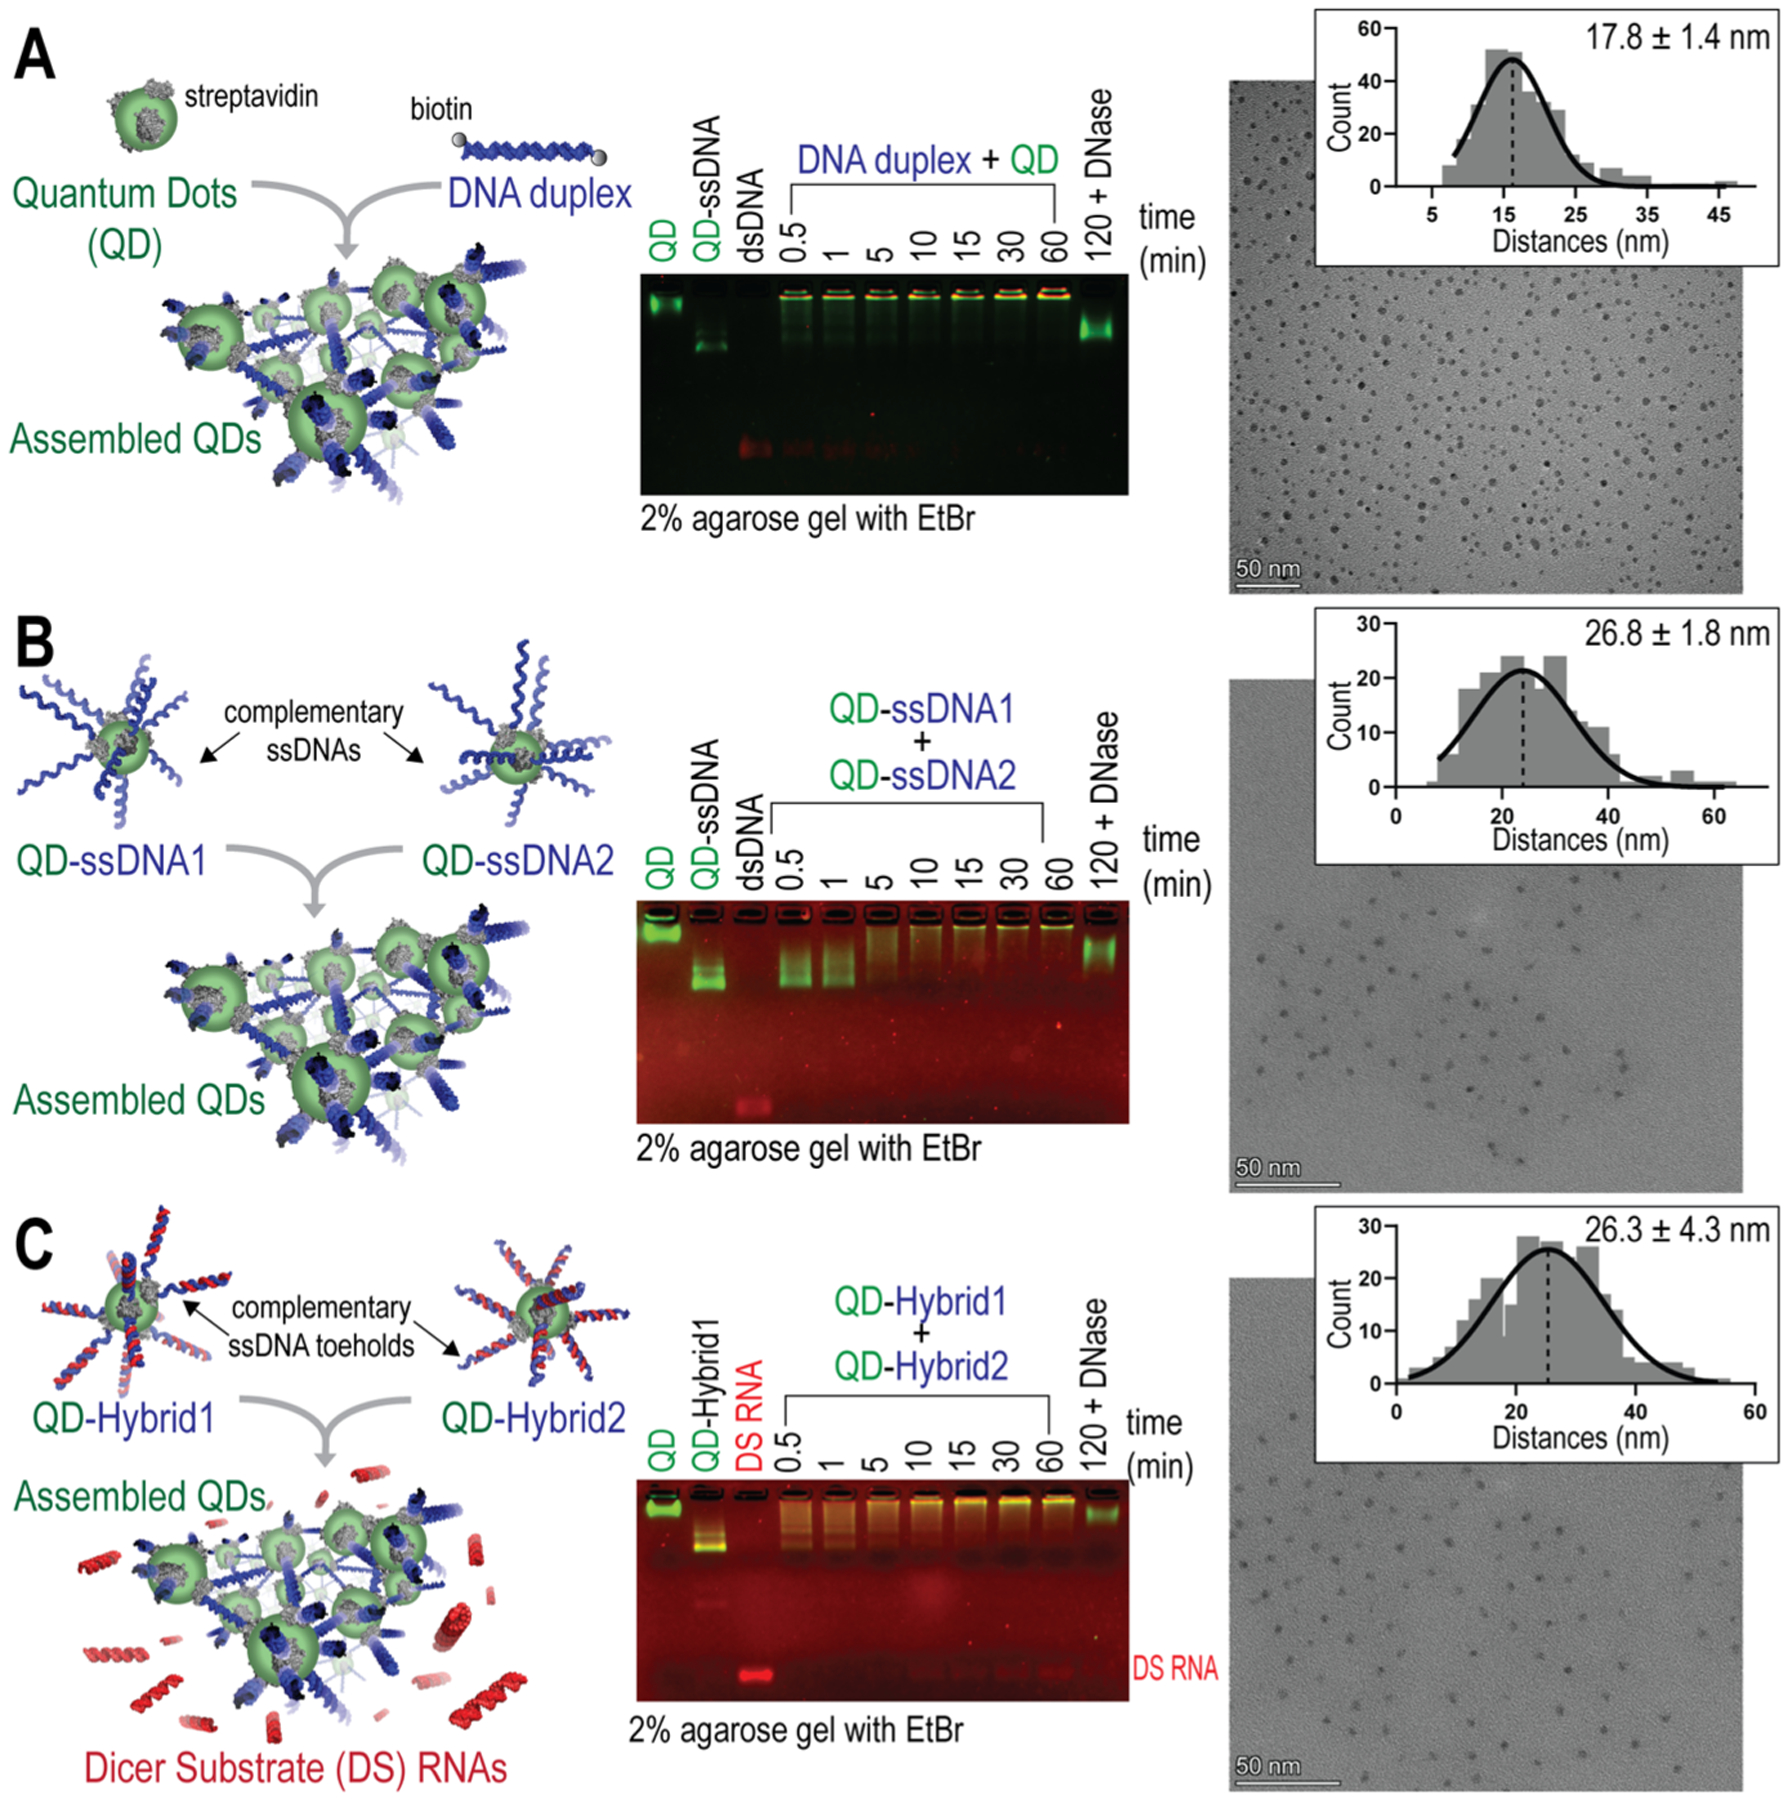
Three protocols of QD assembly with kinetics characterized by agarose gels. TEM images showing the distribution of QDs within their assemblies and measurements of the center-to-center distances presented in the histogram with their Gaussian fit for n = 100 QDs. Scale bar = 50 nm. Mean center-to-center distances calculated from n = 3 TEM images are shown with ± SEM. (A) QDs mixed with double-biotinylated DNA duplexes. (B) QDs decorated with complementary ssDNAs. (C) QDs decorated with RNA/DNA hybrids that reassociate via the complementary ssDNA toehold interactions and release DS RNAs.