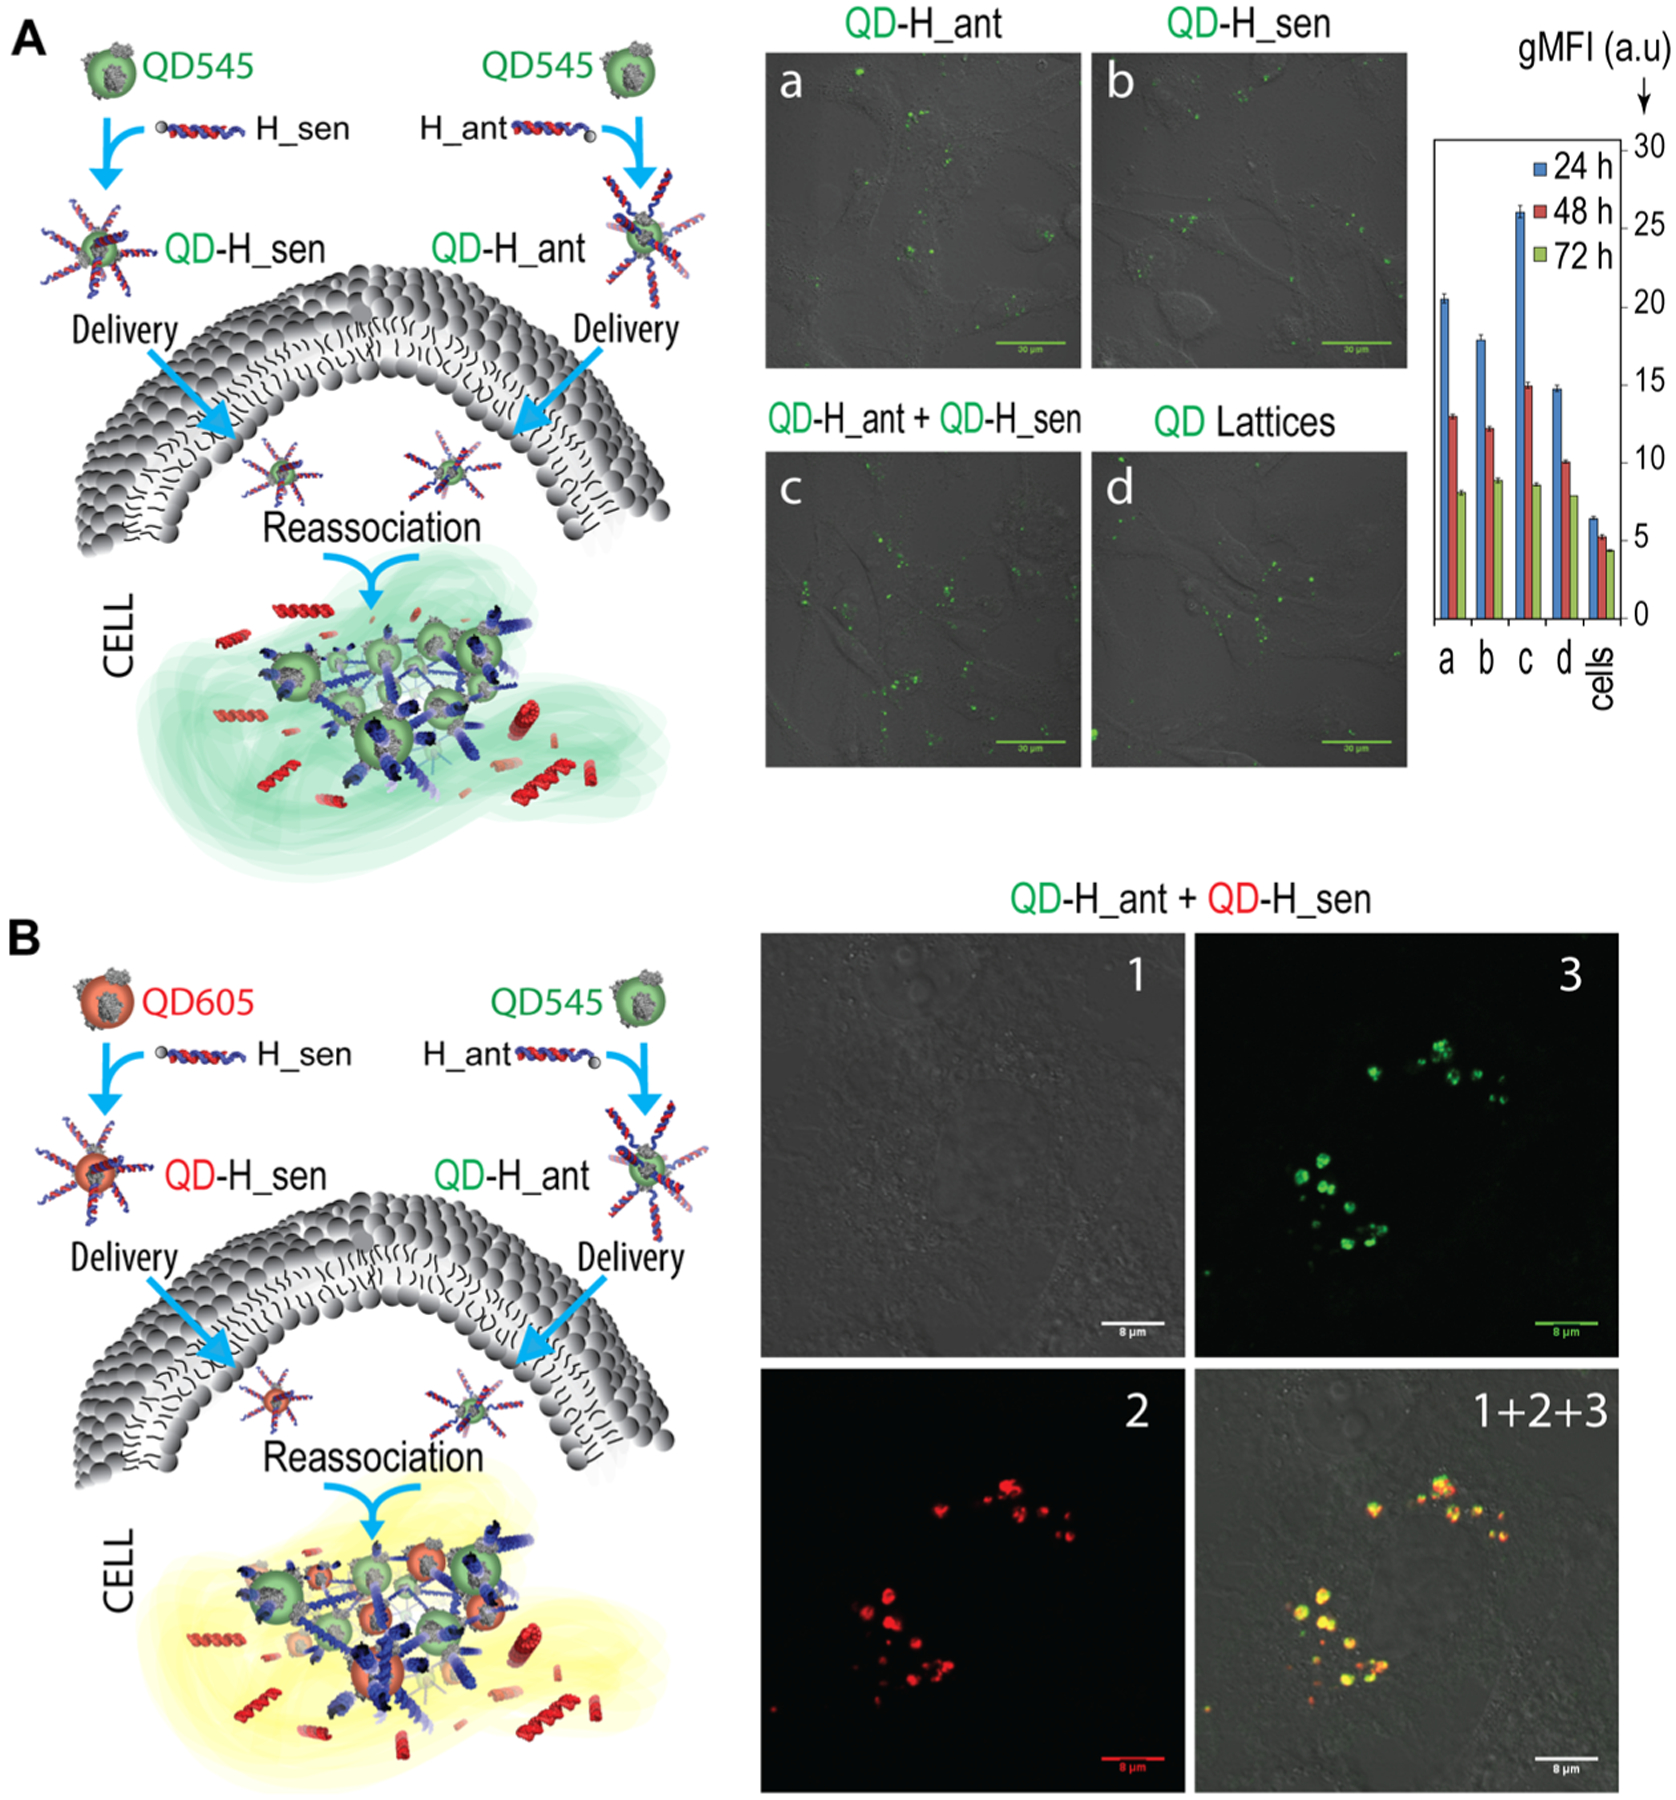
Figure 4.

Relative uptake efficiencies and intracellular colocalization experiments. (A) The uptake of functionalized QD545 was analyzed by fluorescence microscopy and flow cytometry. Scale = 30 μm. Bars denote mean ± SEM of n = 20,000 individual events. (B) Colocalization of QD545 (green) and QD605 (red) entering the composition of QD assemblies as analyzed by confocal microscopy. Image numbers correspond to (1) differential interference contrast, (2) QD605 emission, and (3) QD545 emission. Image (1 + 2 + 3) is the superposition of three different images, scale = 8 μm.
