
Fig 3. SWD bursts in adult control, DLP, DLP-RAP633, and Sham rats using epidural recordings.
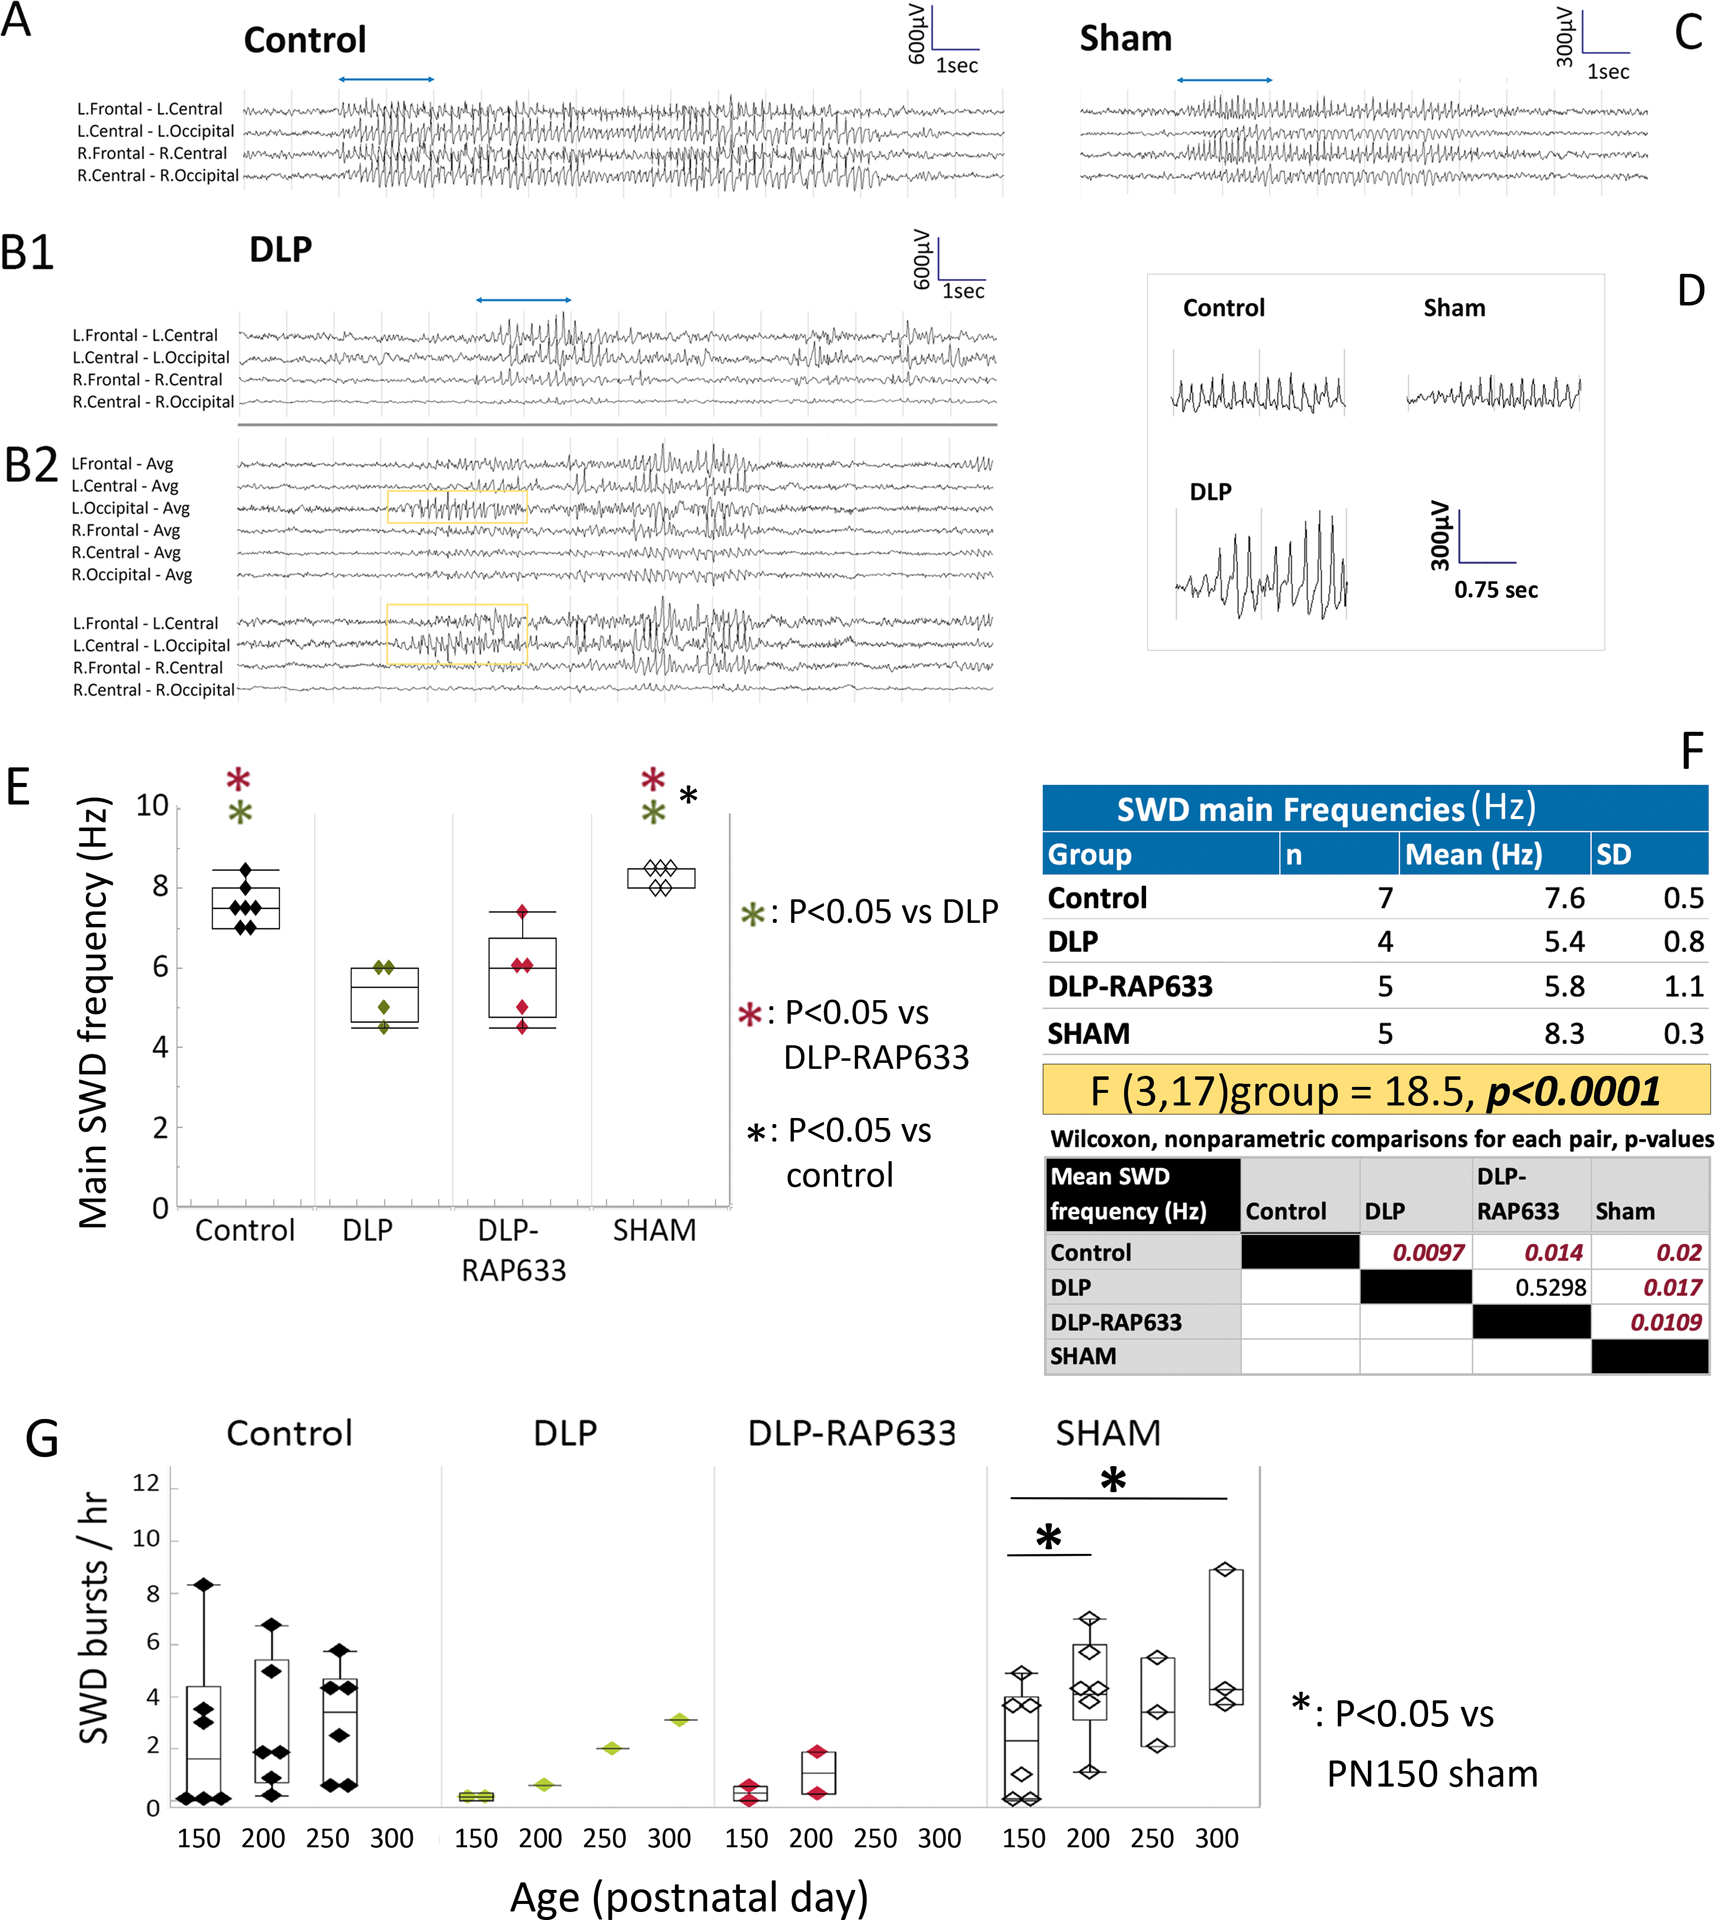
Panel A. Example of a SWD burst in a control rat. Bipolar montages demonstrate bilateral onsets maximal frontally.
Panel B1 and B2. Example of focal SWD burst in a DLP rat, maximal at the left frontal region (B1). Panel B2 shows an atypical SWD with a hypersynchronous lead with rhythmic left occipital SWDs (yellow box) evolving into a SWD.
Panel C. Example of a SWD burst in a SHAM operated rat.
Panel D. SWD waveforms from each panel are shown with an expanded time scale (first 2 sec of bursts in panels A-D, shown with the blue lines in panels A, B1, C).
Panels E-F. Main frequencies of SWD bursts in adult rats. Spectral characteristics of SWD bursts were done using the first 2 seconds of the bursts in the EEG tracings from the right and left central electrodes, referenced to a common reference. Comparisons of the mean SWD main frequency values of each rat indicated a significant group effect [F(3,17)group = 18.5, p<0.0001, mixed model analysis] (panel F). DLP and DLP-RAP633 have slower main SWD frequencies than sham or control rats (p<0.05, hence they are called here as “slow-SWD”. Sham rats also had faster SWD main frequencies compared to controls. No significant difference in SWD main frequencies between right and left central electrode recordings were found in the various groups.
Panel G. Rates of SWD bursts per hour in adult rats across different age groups (PN150, PN200, PN250, PN300) and groups. Comparison of the mean SWD burst rates (SWD bursts/hr) of each rat using Wilcoxon test did not yield significant group effects. Linear mixed model analysis of hourly rates of SWD bursts as a function of age, for each group separately, using repeated measures, indicated significant age-related increase for the sham group only [PN150 vs PN200, p=0.043; PN150 vs PN300, p=0.009], although DLP and DLP-RAP633 groups had small sample sizes.