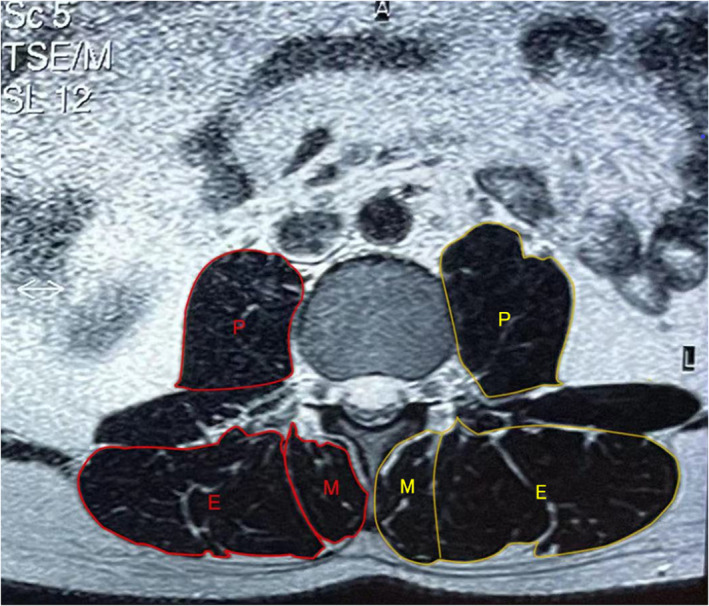
Fig. 1.

Erector spinae (E), multifidus (M), and psoas muscles (P) were segmented separately on right and left sides on the axial slice at mid‐disc of L4–L5 and L5–S1 on T2‐weighted axial images. The above parameters were measured unilaterally. The red line area is functional CSA (F‐CSA), which represents fat‐free area, evaluated quantitively by excluding the signal of the deposits of intramuscular fat. The signal intensity can distinguish fat and muscle tissue in a different range. Based on this, the yellow line area is total CSA (T‐CSA), which represents the sum of CSA of interested three muscles.
