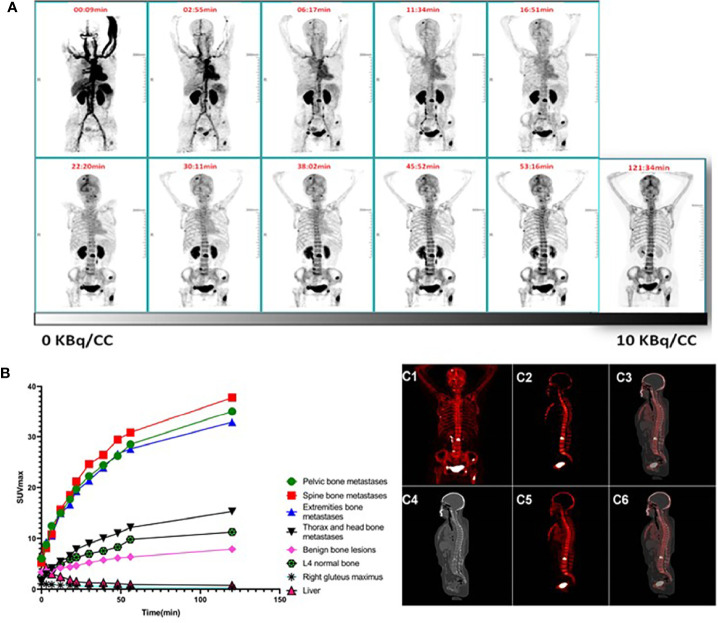
Figure 1.
(A–C) Pharmacokinetics of 68Ga-P15-04.1(A) Dynamic Maximum-intensity projections (MIP) of patient #3 who received 220.5 MBq 68Ga-P15-041. Top row indicates starting time (min) of whole-body scan. (B) Kinetic curves for SUVmax of different sites and lesions with time. Rapid uptake in bone lesions suggest that optimal images may be obtained at early time points. (C) Patlak maps and static SUV image of a representative patient (Same patient as in panel A). (C1, C2) The MIP and a sagittal slice of the Patlak map; (C3) the merged image of the Patlak map and CT; (C4) the corresponding sagittal CT slice; (C5, C6) the corresponding sagittal slice of the routine PET and fused PET/CT.

