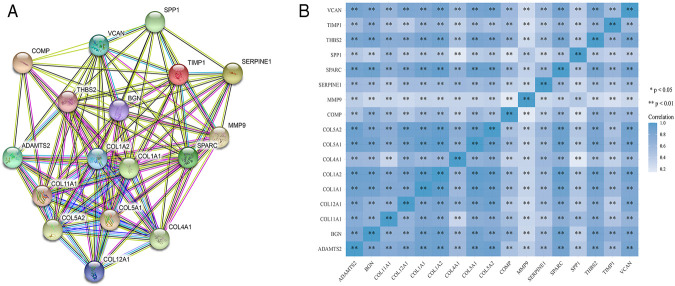
FIGURE 3.
The PPI interaction network and co-expression based on the hub genes. (A) The PPI interaction network of the hub genes-coded proteins. Nodes represent proteins and edges represent interactions between two proteins. (B) The heatmap of the co-expression of the hub genes. The darker the color, the stronger the correlation. Asterisks represent levels of significance (*p < 0.05, **p < 0.01).

