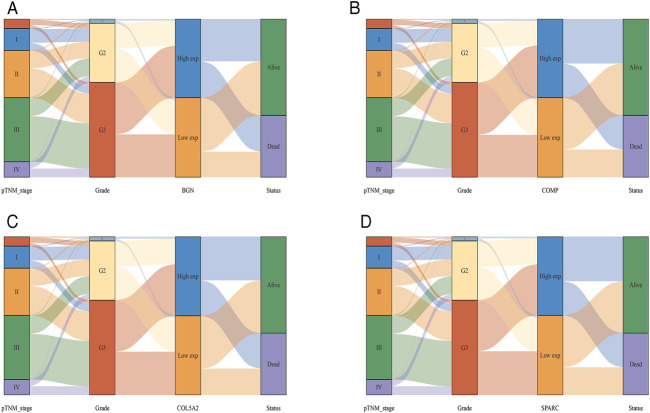
FIGURE 5.
The Sankey diagram based on four hub genes with clinical and prognostic significance. (A), BGN; (B), COMP; (C), COL5A2; and (D), SPARC. Each column represents a characteristic variable, different colors represent different types, status, or stages, and lines represent the distribution of the same sample in different characteristic variables.

