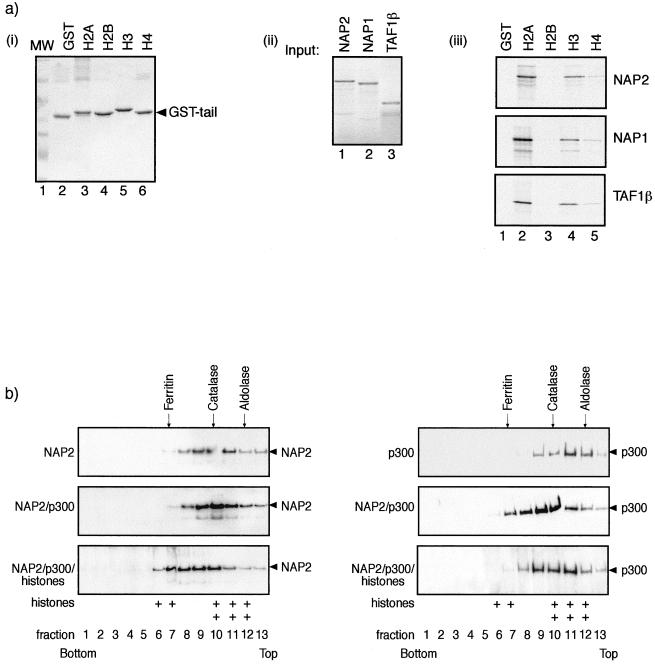
FIG. 5.
NAP2 binds to core histones. (a) Panel i, about 1 μg of GST (lane 2), GST-H2A (lane 3), H2B (lane 4), H3 (lane 5), or H6 (lane 6) N-terminal tail fusion proteins was stained by Coomassie blue. Lane 1 shows the molecular weight standards. Panel ii, in vitro-translated NAP2 (lane 1), NAP1 (lane 2), and TAF1β (lane 3) showing 10% of the input used for panel iii. Panel iii, binding between in vitro-translated NAP2 (top), NAP1 (middle), or TAF1β (bottom) and the indicated GST proteins. Note that upon longer exposure, specific binding was apparent between the NAP proteins and H2B and H4 tails. (b) Sucrose gradient analysis was performed as described previously on either NAP2 alone, NAP2 and p300, or NAP2, p300, and core histones, using 2 μg of each pure protein preparation or 4 μg of core histones. Samples were subjected to 20 to 50% sucrose gradient centrifugation, and fractions were analyzed by SDS-PAGE and immunoblotted with anti-NAP2, anti-p300, or anti-H2A-H2B. Note that when NAP2, p300, and core histones were analyzed together, the extent of sedimentation increased. The distribution of core histones H2A-H2B in fractions 6, 7, and 8 in the NAP2-p300-histone gradient (bottom) is indicated by +; in the absence of all three proteins, histones appeared predominantly in fractions 10, 11, and 12. The positions of the standard molecular masses of aldolase (158 kDa), catalase (232 kDa), and ferritin (440 kDa) are shown. Wild-type His-NAP2 and Flag-p3001135–2414 were used in the analysis.

