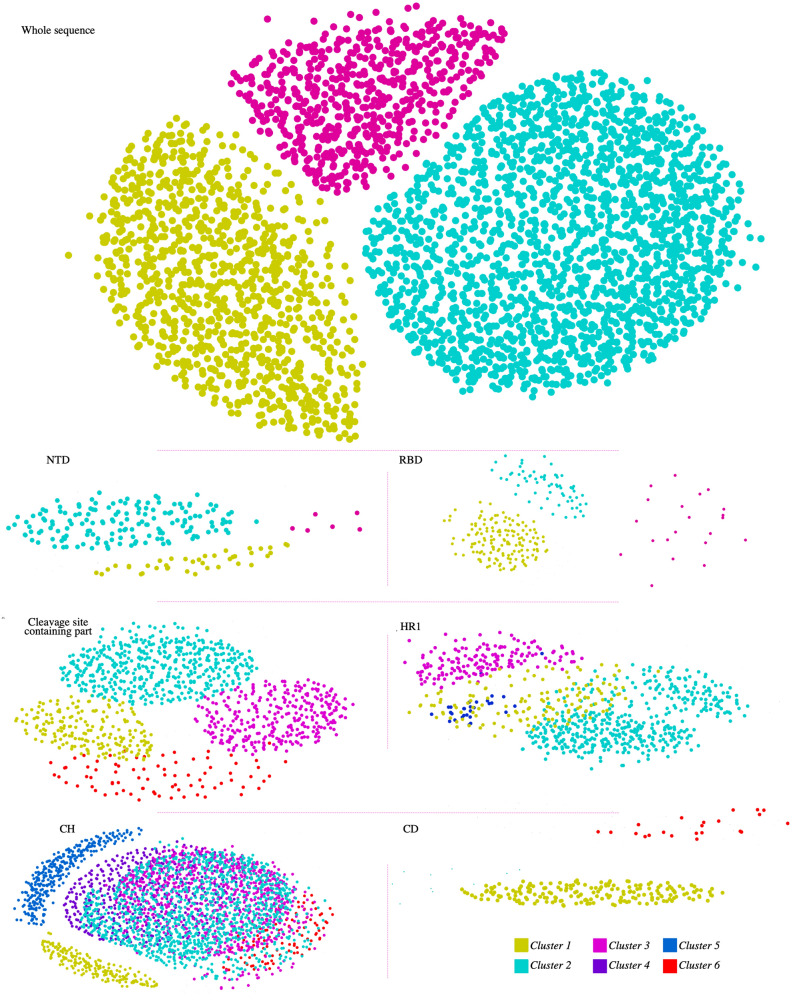
Figure 1.
Visualization of the CLANS analysis results. Each panel shows the graphical two-dimensional representation of each dataset. Nodes represent the sequences in the analyzed dataset. Each sequence set includes the related domain and the corresponding homologous sequences derived from HMM profiling. The clusters are the results of the network-based clustering function of the CLANS software. The upper panel shows the clustering analysis from full-length sequences, and other panels are clusters from just the identified domain (labeled on the bottom left of each group). The nodes are colored based on the number of clusters (color key at bottom right). The sequence of SgpSARS-CoV-2 or its domains is involved in cluster 1 in each group, except for the N-terminal domain (NTD); which is not involved in any cluster. The details of the clusters are summarized in Table 2.

