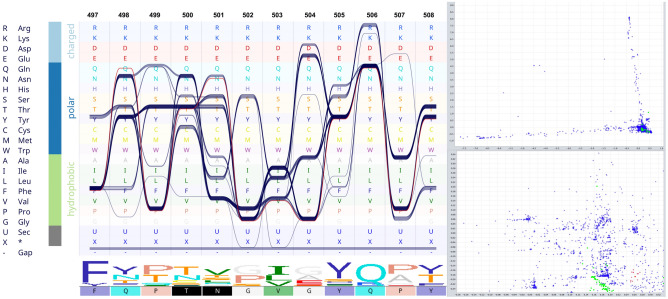
Figure 2.
Combination of sequence bundle plot with sequence logo and correspondence scattered plot. The top left panel was initiated with different amino acids sorted by their chemical properties. Additionally, the top panel displays every sequence in the alignment as an individual continuous line, whose shapes correspond to the residues of that sequence. Multiple sequences that have the same residue are stacked on top of each other, thereby forming a thick bundle (conserved site). The sequence logo of the alignment section is also presented below the bundles and is followed by a color-coded sequence of SgpSARS-CoV-2. The top left section shows the correspondence analysis scattered plot. Sequences are shown as green circles and sites as blue crosses. The SgpSARS-CoV-2 sequence and nearby sites are selected (red colors). The selected sites (shown in red color) are mirrored in the sequence of SgpSARS-CoV-2 at the lower panel (black boxes). Residues Thr500 and Asn501 are identified as significantly associated with SgpSARS-CoV-2. The lower left is a zoom-in view of the selected site.

