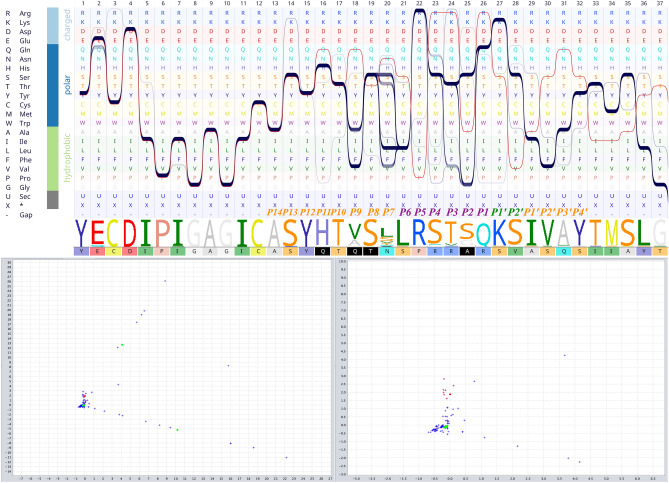
Figure 6.
Bundle representation of furin cleavage site and correspondence scatter plot. The left panel shows the one-to-one comparison of sequence MSA of the furin cleavage sites of different coronaviruses. The 20 amino acids of the furin cleavage motif are depicted by different colors on the top of the sequence alignment logo (P stands for the position). The color scheme of fonts is based on reference38. Amino acids are sorted based on their biochemical properties. Each continuous line represents a sequence in the alignment. The red line is the sequence of the SgpSARS-CoV-2 furin cleavage site. The lower panel shows the correspondence scatterplot and a close look at the selected correspondence sites (left and right panels, respectively). The corresponding residues are in black boxes in the sequence of SgpSARS-CoV-2 on the left panel. X and Y axes are the first and second principal components, respectively.

