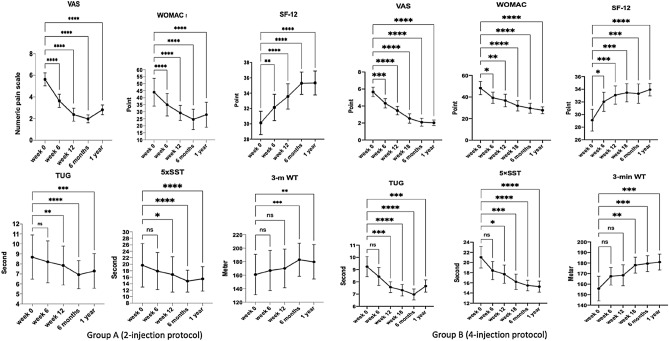
Figure 4.
Demonstrating similar clinical outcomes of group A and B changes from baseline (week 0) to 6 weeks, 12 weeks, 18 weeks (only in group B), 6 months, and 1 year of FU. The VAS, WOMAC index, and SF-12 significantly improved from 6 weeks to one year in both groups. The TUG and 5 × SST significantly improved from 12 weeks to 1 year in both groups. The 3-m WT significantly improved from 6 months and 18 weeks to 1 year in group A and B, respectively (asterisks: *P ≤ 0.05, **P ≤ 0.01, ***P ≤ 0.001, and ****P ≤ 0.0001 vs baseline values).

