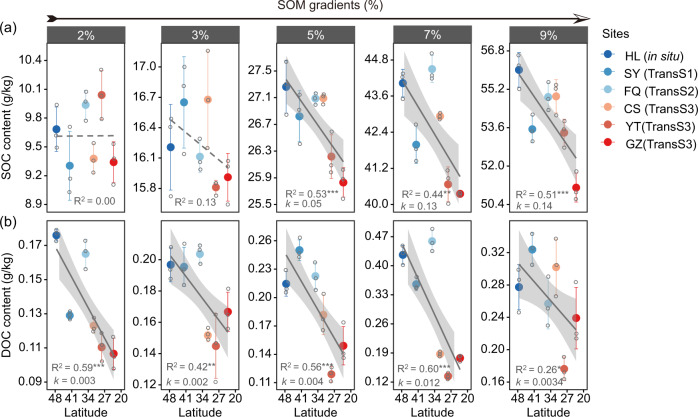
Fig. 2. Responses of soil C to climate change.
Linear fitting analysis for SOC (a) and DOC (b) and latitude. The fitting curve type was determined by comparing the Akaike information criterion (AIC) value. The solid and dashed lines represent significant (p < 0.05) and nonsignificant (p > 0.05) models, respectively. The different-colored circles represent different sampling sites from high to low latitudes. R2 and k represent the amount of interpretation and the fitting slope of the model, respectively. The error bar is the standard deviation (n = 3). Significance is presented by *p < 0.05, **p < 0.01, and ***p < 0.001.

