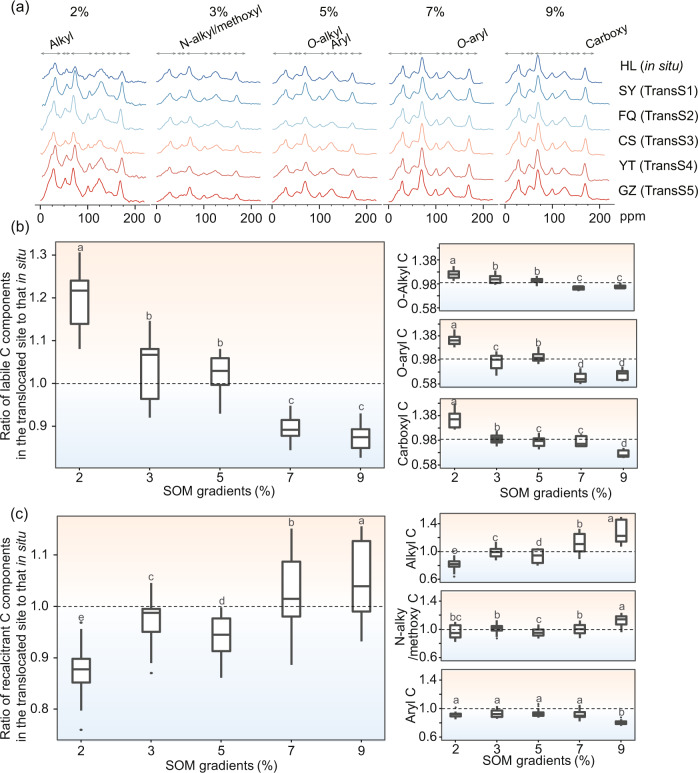
Fig. 3. Response of different functional groups of SOC to translocation warming.
In the boxplot, the middle line of the box is the median of the data. The upper and lower limits of the box are the upper and lower quartiles of the data, respectively. 13C solid-state NMR spectra of SOC with different molecular structures (a). Ratios of the abundance of labile C (b) and recalcitrant C (c) components in the five translocation sites to the abundance of the corresponding C components in the in situ HL site. Compared with in situ site, a ratio greater than 1 indicates that translocation-related warming increases the stability of carbon, whereas a ratio less than 1 shows that translocation-related warming reduces the stability of carbon. The differences in C stability among soils with different organic matter contents were statistically determined using TukeyHSD method. Different lowercase letters indicate significant differences, and the same lowercase letters indicate nonsignificant differences.

