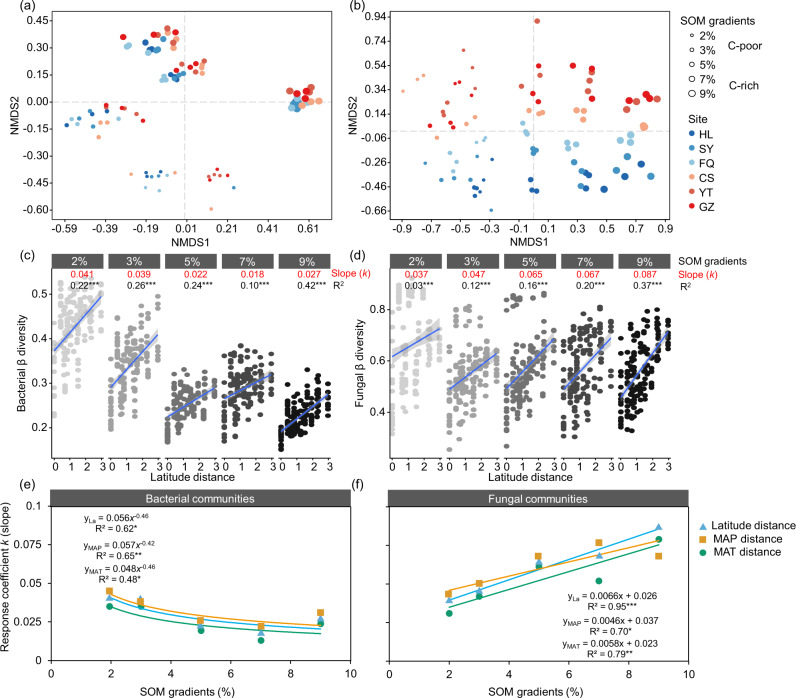
Fig. 4. Effects of SOM gradients and climate change on the microbial community composition.
Nonmetric multidimensional scaling (NMDS) analysis of bacterial (a) and fungal communities (b). The size and color of the circle represent the SOM content and the different sampling sites from north to south, respectively. Linear fitting relationships of the latitude distance with the bacterial β-diversity (c) and the fungal β-diversity (d). The variable k (slope) is the response coefficient of β to the distance of latitude (climate change). In this study, the response coefficient represents the rate of change in the community composition. R2 is the amount of interpretation of the model. Relationships of the content of SOM with the climatic response coefficients of the bacterial (e) and fungal (f) β-diversity. These climatic response coefficients include the response coefficients (k) of the β-diversity to changes in latitude, MAT, and MAP. The circles with different colors represent the climatic response coefficients of bacteria and fungi to different factors, including latitude (sky blue), MAP (orange), and MAT (bluish green).

