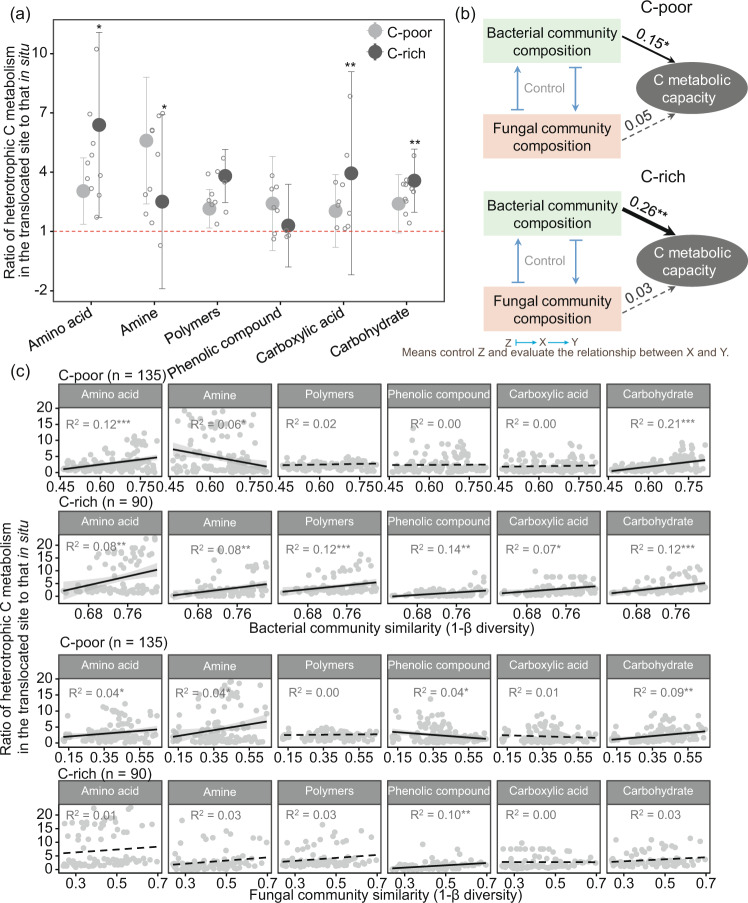
Fig. 5. Relationship between C metabolic capacity and microbial communities.
C metabolic capacity (i.e., standard OD values) of different types of C sources in C-poor and C-rich soils (a). Compared with the in situ (HL) site, a ratio greater than 1 indicates that translocation-related warming increases the C metabolism of microorganisms, whereas a ratio less than 1 shows that translocation-related warming reduces the C metabolism of microorganisms. Significance was assessed by a paired t-test of the mean C metabolic capacity of five translocated sites in C-poor vs. C-rich soils. The error bar represents the standard deviation (n = 5). Partial Mantel analysis between bacterial and fungal community composition and C metabolic capacity in C-poor and C-rich soils (b). The black solid lines with arrows represent significant correlations, whereas the dashed gray lines represent nonsignificant correlations. The numbers adjacent to the arrows are correlation coefficients. Fitting analysis between the bacterial and fungal community similarity and C metabolism changes (c). Both community similarity and C metabolism changes were obtained and compared with those in the in situ HL site. Significance is presented by *p < 0.05, **p < 0.01, and ***p < 0.001.

