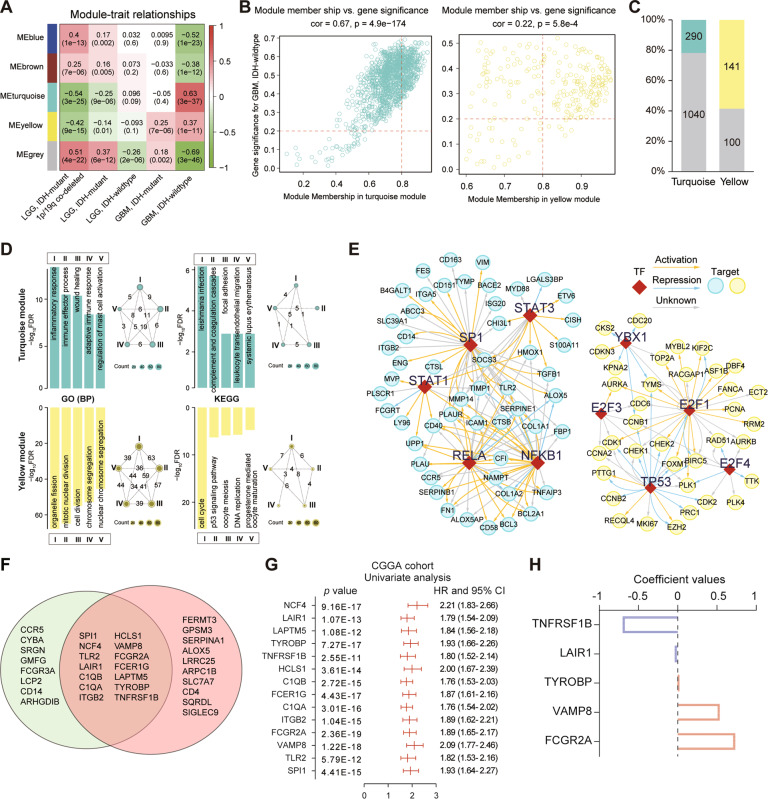
Fig. 1. Construction of a prognostic risk signature for OS by WGCNA and LASSO analysis.
A Heatmap shows correlation between the gene modules and clinical traits. Each cell contains the corresponding correlation and p value. B The Module Membership (MM) versus Gene Significance (GS) scatterplot for GBM with IDH wildtype in turquoise or yellow module. Each dot represents a gene, and the red lines were set as a threshold for Module Membership > 0.8 and Gene Significance > 0.2. C The proportion of candidate hub genes in the turquoise and yellow modules. D GO (BP) and KEGG enrichment annotation of candidate hub genes in turquoise or yellow module. GO gene ontology, BP biological process. In the network diagram, the roman number residing in each circle represents a functional term; values on each line indicate number of overlap genes between terms. E Key regulated upstream transcription regulators (TFs) of candidate hub genes in module by TRRUST. F Hub genes were selected based on overlap between co-expression network and STRING analysis. G Univariate Cox regression results for the 14 genes in the CGGA dataset. H Coefficient values of the five selected genes by LASSO.

