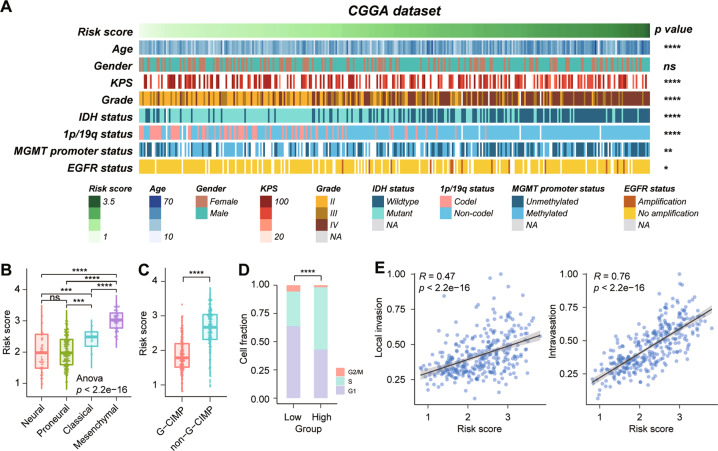
Fig. 2. Relationship between the signature risk score and the pathological characteristics in the CGGA dataset.
A The distribution of clinical and pathological characteristics arranged by the increasing risk score. B, C Distribution of risk score in patients stratified by TCGA subtype and G-CIMP subtype. D The relationship between risk score and cell-cycle proportion in the CGGA dataset. E The correlation between risk score and invasion index was analyzed by Pearson correlation analysis. ****p < 0.0001; ***p < 0.001; **p < 0.01; *p < 0.05; n.s. no significance.

