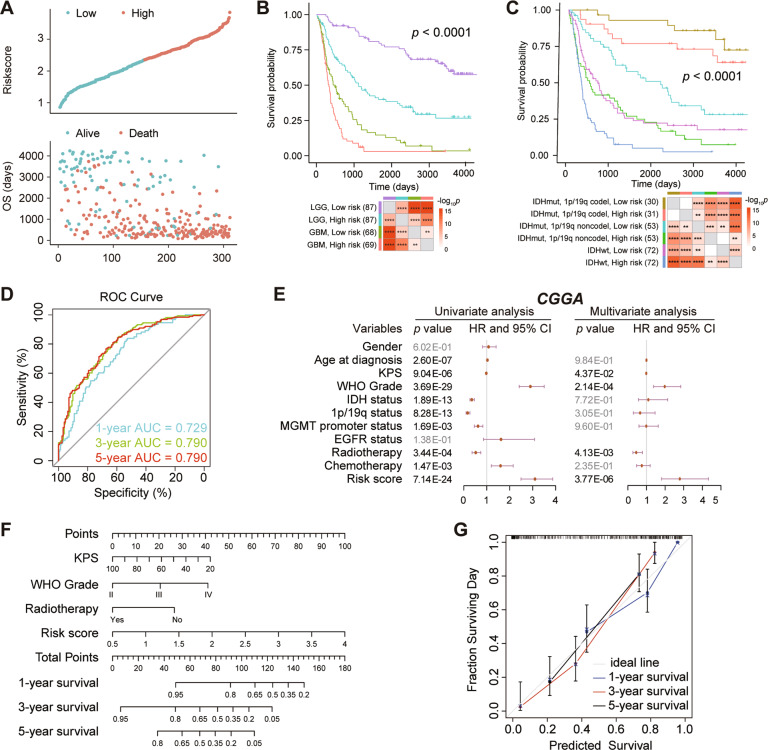
Fig. 4. The prognostic value of the five-gene prognostic signature in CGGA dataset.
A The risk score distribution (top) and survival status distribution (bottom) for glioma patients. B Kaplan–Meier survival curves for patients with glioma, classified into four groups based on grade and risk scores. C Kaplan–Meier survival curves for patients with glioma, classified by molecular pathological characteristic and risk scores. D ROC curves verified the prognostic performance of the risk score. E Univariate and multivariate Cox regression analyses of the association between clinic pathological factors and OS of patients. F Construction of a nomogram for survival prediction. G The calibration curve for the nomogram model. Three colored lines (blue, red and black) represent the performance of the nomogram. A closer fit to the diagonal gray line indicates a better estimation. ****p < 0.0001; ***p < 0.001; **p < 0.01.

