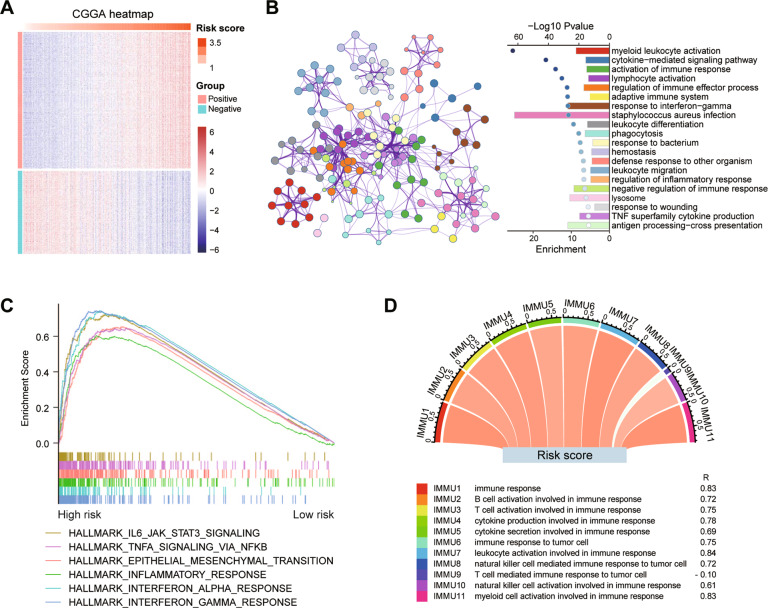
Fig. 5. GO and GSEA annotation of genes associated with risk score in the CGGA dataset.
A Heatmap of genes that are positively and negatively associated with risk score. B Functional enrichment of the positive related genes with the risk score by Metascape. C Enriched gene sets in HALLMARK collection by samples with high-risk score. D The correlation coefficient between risk score and different immune function scores. IMMU9 represents a negative correlation and other IMMNUs represent a positive correlation.

