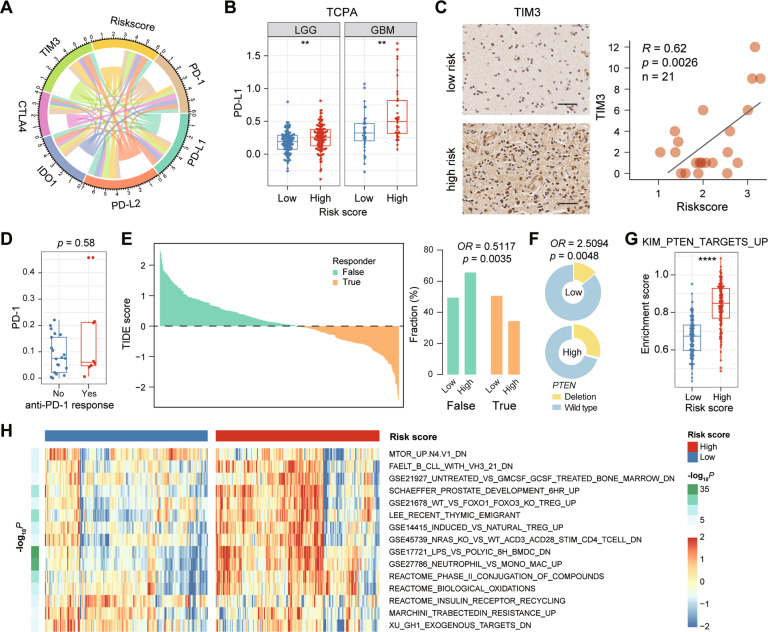
Fig. 7. The relationship between risk score and tumor immune response.
A The correlation coefficient between risk score and immune checkpoints. B The distribution of PD-L1 protein level in the high- and low-risk groups based on the TCPA datasets. **, p < 0.01. C The distribution of TIM3 protein level in the high- and low-risk groups by IHC staining. Scale bar, 50 μm. D The distribution of PD-1 expression in GBM patients before treatment with PD-1 inhibitors. **, p < 0.01. E The TIDE score and response results to immunotherapy of patients with glioma. F Fraction of PTEN loss in the low-risk group versus high-risk group. G GSEA enrichment score of gene-set KIM_PTEN_TARGETS_UP for the low-risk group versus high-risk group. ****, p < 0.0001. H Heatmap showing the gene sets differentially enriched in the low-risk group versus high-risk group.

