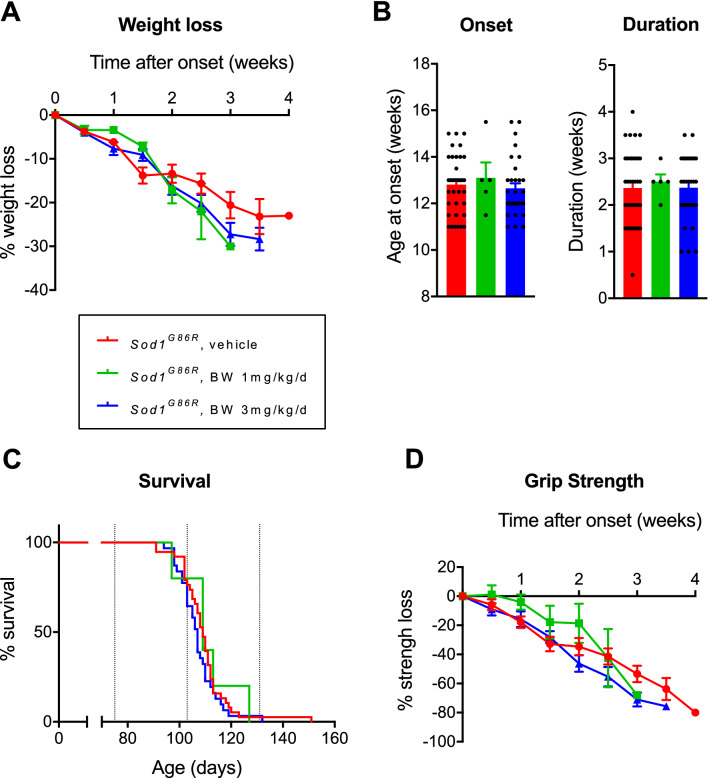
Figure 2.
BW neither modifies survival nor motor function in Sod1G86R mice. (A) Loss of body weight represented as percentage of loss after onset. Represented as mean +/− SEM. (B) Mice age at onset, defined as the peak of body weight and disease duration calculated as time between onset and death. Represented as mean +/− SEM. (C) Kaplan–Meier curve of survival. (D) Loss of muscular strength represented as percentage of loss after onset. Represented as mean +/− SEM. Groups are displayed as follow : Sod1G86R in red (N = 38), Sod1G86R treated with BW at 1 mg/kg/d in green (N = 5) and Sod1G86R treated with BW at 3 mg/kg/d in blue (N = 31).

