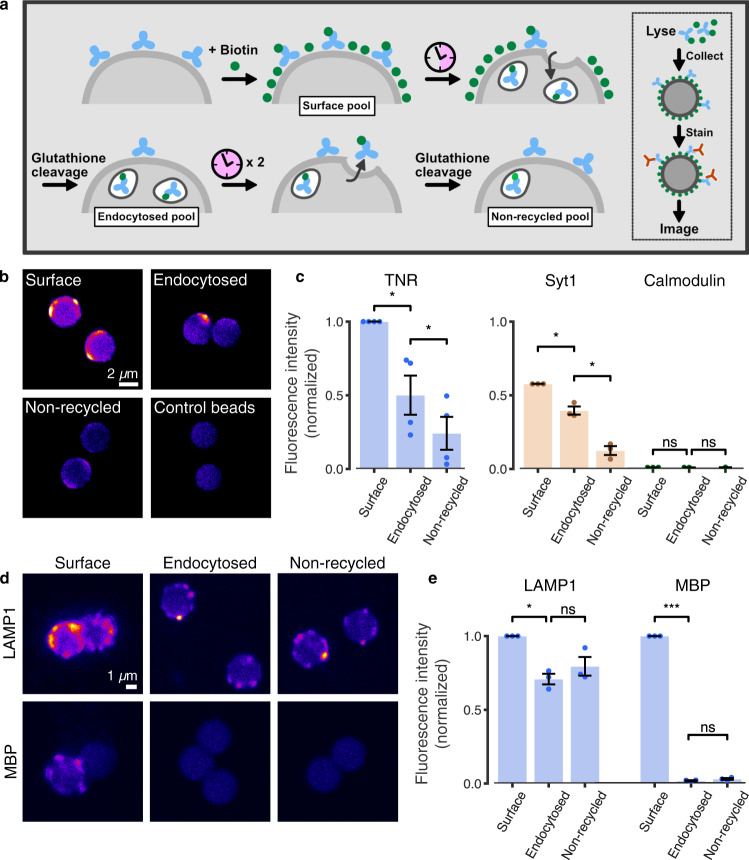
Fig. 1. TNR molecules endocytose and subsequently resurface in neurons.
a Neurons were treated with sulfo-NHS-S-S-biotin to label cell-surface proteins. Following a 6-h incubation, allowing for internalization, remaining cell-surface proteins were stripped of their labels with glutathione. After a further 18 h of incubation, allowing for recycling, the neurons were again treated with glutathione. Lysates representing surface, endocytosed or non-recycled pools, were collected on streptavidin-coupled beads, immunostained for TNR, immobilized on glass slides and imaged with confocal microscopy. b Example beads collecting TNR pools, or controls incubated without primary antibodies. Scale bar = 2 µm. c A quantification of TNR fluorescence intensity normalized to the ‘surface’ mean in the corresponding experiment, indicates that a large fraction of TNR molecules endocytose within 6 h, and many subsequently resurface within 24 h. As positive/negative controls, the synaptic vesicle protein Syt1, well-known to recycle, and the intracellular protein calmodulin were tested. The plots are scaled by the ratio between the ‘surface’ mean for these proteins and that of TNR. N = 4 (TNR) and 3 (Syt1/calmodulin) independent experiments with >100 (TNR) and >50 (Syt/calmodulin) beads. d, e As additional controls, the lysosomal marker LAMP1, known to endocytose but scarcely recycle, and myelin basic protein (MBP), which should not endocytose, were also tested. Scale bar = 1 μm. e Quantification of LAMP1/MBP fluorescence intensity, normalized to the ‘surface’ mean of the corresponding experiment. N = 3 independent experiments with > 50 beads. Statistical significance was evaluated using repeated-measures one-way ANOVA, (c TNR: F1.153,3.458 = 28.29, **p = 0.009; Syt1: F1.007,2.014 = 62.98, *p = 0.015; calmodulin: F1,2 = 0.016, p = 0.912; e LAMP1: F1.293,2.585 = 19.6, *p = 0.028; MBP: F1.52,3.041 = 28337, ***p < 0.001), followed by the Holm-Sidak multiple comparisons test comparing ‘surface’/‘endocytosed’ and ‘endocytosed’/‘non-recycled’ (c TNR: *p = 0.032, *p = 0.021; Syt1: *p = 0.044, *p = 0.044; calmodulin: p = 0.933, p = 0.993; e LAMP1: *p = 0.045, p = 0.162; MBP: ***p < 0.001, p = 0.068). Data represent the mean ± SEM, dots indicate individual experiments. Source data are provided in Source Data file.

