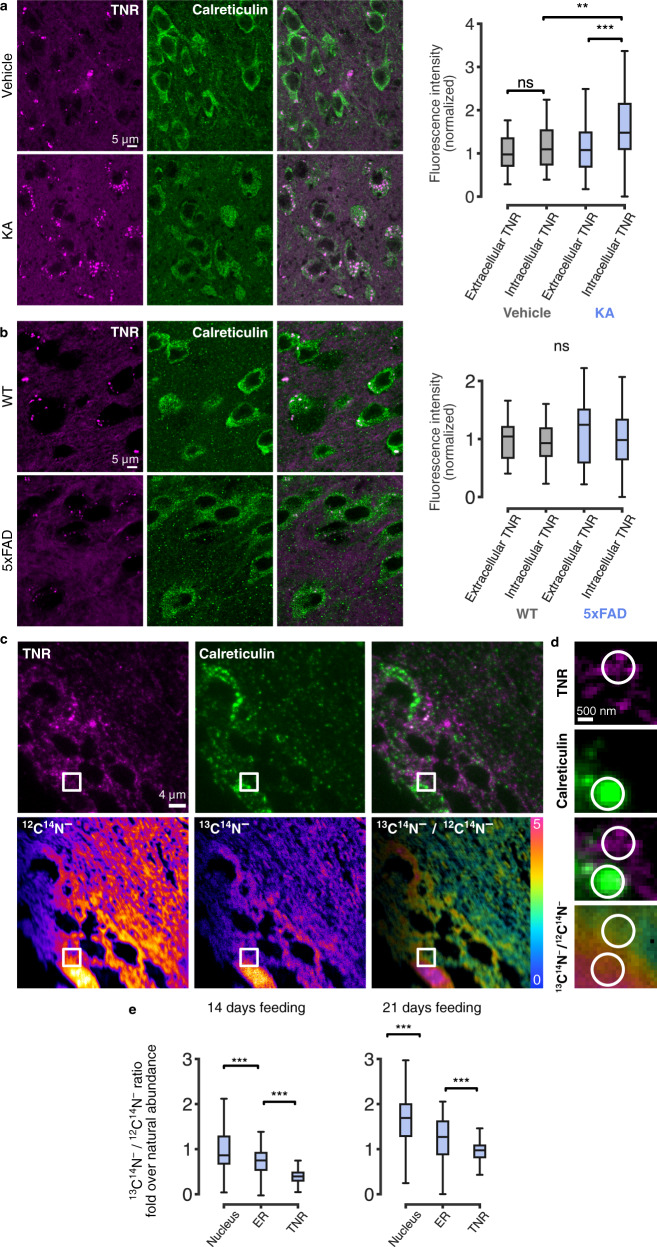
Fig. 10. TNR dynamics are observed in brain slices from adult mice, and are altered in an epilepsy model.
a, b Intracellular TNR in disease models. Hippocampal slices from kainic acid (KA)-induced epilepsy model mice and 5xFAD familial Alzheimer’s disease model mice were immunostained for TNR and the ER marker calreticulin, to enable identification of intracellular (somatic) TNR. All other TNR was presumed extracellular. a Imaged regions (confocal) from mice pre-treated with vehicle or KA. The proportion of intracellular TNR is increased in KA-treated mice. N = 3 mice per treatment, 60 (vehicle) and 67 (KA) regions analyzed. Kruskal-Wallis (H3 = 27.93, ***p < 0.001), followed by two-sided Dunn’s multiple comparisons test (‘vehicle; extracellular TNR’/‘vehicle; intracellular TNR’: ‘p = 0.932; ‘KA; extracellular TNR’/‘KA; intracellular TNR’: ***p < 0.001; ‘vehicle; intracellular TNR’/‘KA; intracellular TNR’: **p = 0.004). b Similar analysis for 5xFAD mice. No significant differences are observed. N = 3 mice per treatment, 68 (WT) and 29 (5xFAD) regions analyzed. Kruskal-Wallis (H3 = 3.233, p = 0.357). Scale bar = 5 µm. c–e Isotopic imaging in adult mice suggests intracellular TNR is not newly synthesized. TNR turnover in vivo was measured with correlative fluorescence and isotopic imaging (COIN20,48,72,80,81) in brain slices of mice pulsed with isotopically stable 13C6-lysine for 14 or 21 days (previously characterized in2). c Top: section stained for TNR and calreticulin (epifluorescence). Bottom: nanoSIMS images of 12C14N− (left) and 13C14N− (middle) secondary ions. The 13C14N−/12C14N− ratio image (right) indicates the enrichment of 13C. Scale bar = 4 µm. d Zoom of square regions in c. Scale bar = 500 nm. e Quantification of 13C14N−/12C14N ratio as fold over the natural abundance level. TNR-enriched areas exhibit the lowest 13C enrichment in these cells (lowest newly synthesized protein levels). N = 6 sections from 3 mice per condition. Kruskal-Wallis (H2 = 167.2, ***p < 0.001), followed by two-sided Dunn’s multiple comparisons test (***p < 0.001 for all comparisons). For all panels: boxes show median (mid-line) and quartiles, whiskers show minimum/maximum values. Outliers were omitted according to inter-quartile range (IQR) proximity (exceeding 1.5*IQR). Source data provided in Source Data file.

