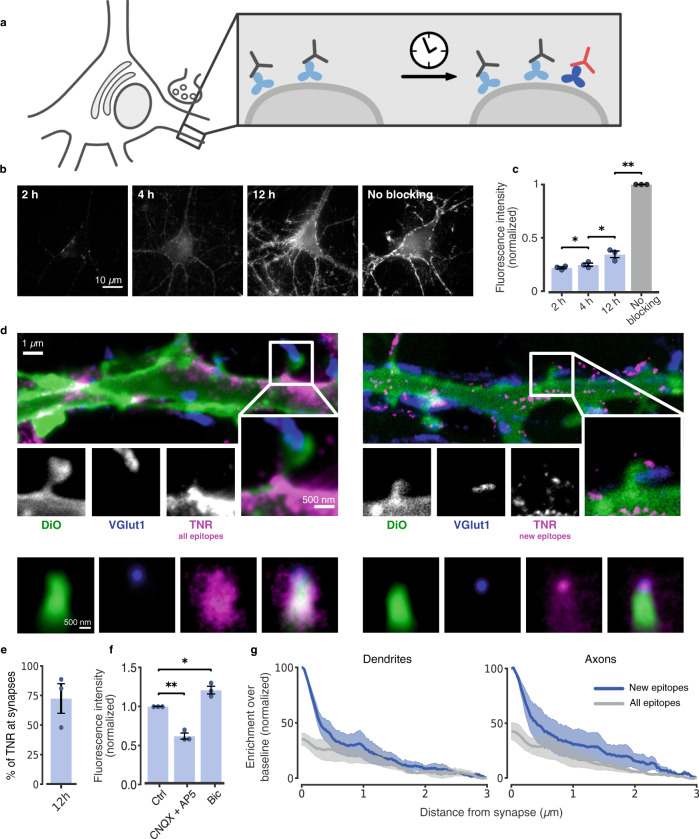
Fig. 2. Dynamic TNR molecules emerge at synapses, in an activity-dependent fashion.
a To monitor dynamic TNR molecules, surface epitopes were blocked by incubating with non-fluorescent TNR antibodies (gray). After some time, fluorophore-conjugated antibodies were applied (red) to reveal newly-emerged epitopes (dark blue). b Newly-emerged epitopes 2/4/12 h post-blocking, (epifluorescence). Scale bar = 10 µm. c Fluorescence intensity, normalized to non-blocked neurons. N = 3 independent experiments, ≥10 neurons per datapoint. Repeated-measures one-way ANOVA: F1.089,2.179 = 790.8, ***p < 0.001, followed by Fisher’s LSD: ‘2 h’/‘4 h’:*p = 0.041; ‘4 h’/‘12 h’:*p = 0.032; ’12 h’/‘no blocking’: **p = 0.002. d All TNR epitopes (left) or newly-emerged epitopes 12 h post-blocking (right) were revealed (magenta, STED imaging). Membranes of a subset of neurons were labeled using sparse DiO labeling (green, confocal imaging). Presynapses were identified by VGlut1 (blue, STED imaging). Scale bars: 1 µm (full images), 500 nm (insets). Bottom: hundreds of synapses were averaged by centering synapse images on the VGlut1 puncta and orienting the dendritic DiO signals vertically. “All” TNR epitopes cover the entire bouton-dendrite area (left), while newly-emerged epitopes are enriched in the bouton region (right). e Quantification of TNR exchange at synapses (as in c, measuring exclusively TNR at VGlut1-labeled synapses). N = 3 independent experiments with >100 synapses. f Comparison of newly-emerged TNR epitopes 12 h post-blocking in cultures treated with bicuculline (40 µM), or CNQX (10 µM) and AP5 (50 µM). Intensity is normalized to the corresponding control (DMSO). N = 3 experiments, ≥10 neurons per datapoint. One-way ANOVA on rank: F2,6 = 42, ***p < 0.001, followed by Dunn’s multiple comparisons test: ‘ctrl’/‘CNQX + AP5’: **p = 0.003; ‘ctrl’/‘bic’: *p = 0.042. Data represent the mean ± SEM, dots indicate individual experiments. g, Analysis of 2-color-STED images (as shown in d). Synaptic enrichment is substantially higher for newly-emerged epitopes. N = 3 independent experiments with >100 synapses. Repeated-measures one-way ANOVA on log-transformed data: F1.977,3.954 = 24.13, **p = 0.006, followed by Fisher’s LSD: ‘new’/‘all’ epitopes: *p = 0.024 (dendrites); *p = 0.036 (axons). Data represent the mean (line) ± SEM (shaded region). Source data are provided in Source Data file.

