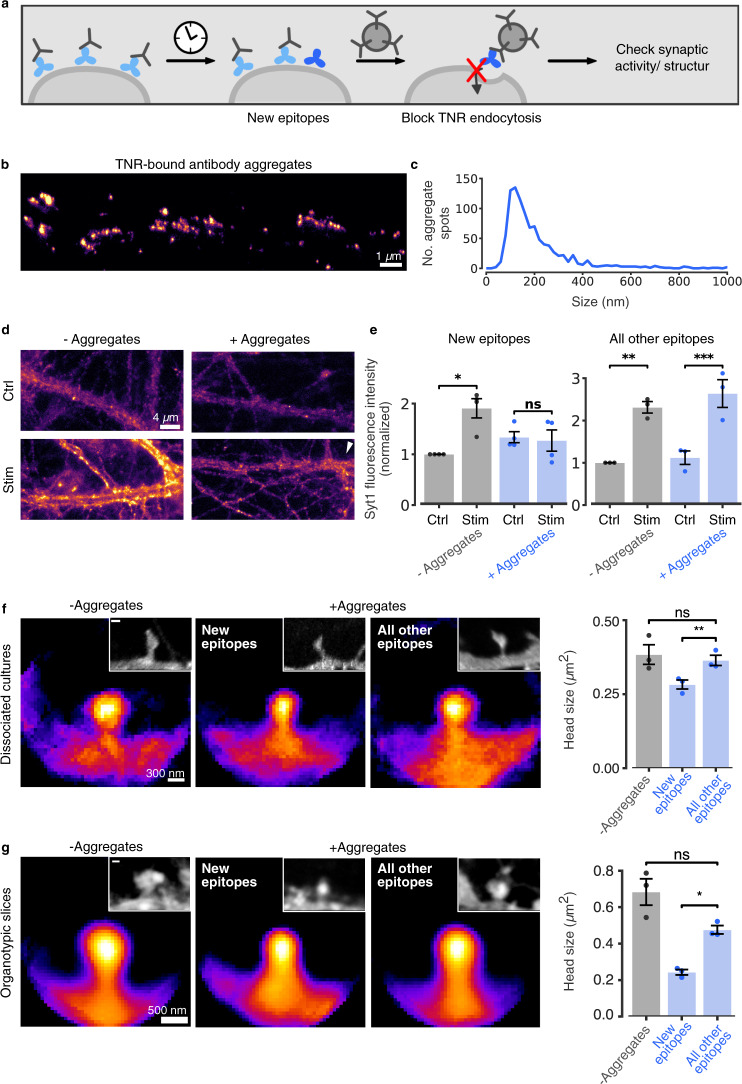
Fig. 9. Perturbing the recycling TNR pool modulates synaptic function.
a Assay to perturb TNR recycling: newly-emerged TNR epitopes were labeled 12 h post-blocking with biotinylated antibodies, and bound to large aggregates of antibodies. As control, all other epitopes (non-recycling) were labeled. b STED images of aggregates. Scale bar = 1 µm. c Histogram of aggregate size (FWHM). N = 4 independent experiments, 995 aggregates. d Neurons were incubated with aggregates for 30 min. Synaptic activity was assessed by uptake of Syt1 antibodies (as in Fig. 3). Without stimulation, Syt1 antibodies detect the surface vesicle population (40–50% of actively-recycling vesicles20). Stimulation results in signal increase (exo-/endocytosis of new vesicles) in controls, but not in aggregate-treated cultures (epifluorescence). Scale bar = 4 µm. e Quantification of Syt1 fluorescence intensity confirms this observation and indicates that tagging all other epitopes has no effects. N = 4 (‘new epitopes’)/3 (‘all other’) independent experiments, ≥15 neurons per datapoint. Repeated-measures ANOVA on rank (‘new epitopes’: F1,6 = 12.54, *p = 0.012; ‘all other epitopes’: F1,4 = 1.5, p = 0.288) for the interaction Stim/ctrl x + /− Aggregates), followed by Sidak’s multiple comparisons test (‘new epitopes’: *p = 0.02, p = 0.419; ‘all other epitopes’: **p = 0.002, ***p < 0.001 for ‘stim’ vs. ‘ctrl’ for untreated and treated neurons, respectively). f, g Effect of recycling perturbation on synapse structure. Dissociated cultures (f) and organotypic hippocampal slices (g) were treated with aggregates for 12 h. Plasma membranes were visualized with DiO (f) or by infection with AAV9-Syn-eGFP (g), in averaged spines or individual examples (insets). Scale bar = 300 nm (f), 500 nm (g). N = 3 independent experiments, >80 (f), >60 (g) synapses per condition. One-way ANOVA (f: F2, 6 = 5.269, *p = 0.05) or repeated-measures one-way ANOVA (g: F1.041, 2.083 = 20.76, *p = 0.042), followed by Fisher’s LSD (f:** p = 0.005, p = 0.418; g: *p = 0.025, p = 0.16), to compare ‘all other epitopes’/‘new epitopes’ and ‘all other epitopes’/‘Tyrode’, respectively. Data represent mean ± SEM, dots indicate individual experiments (d–g). Source data are provided in Source Data file.

