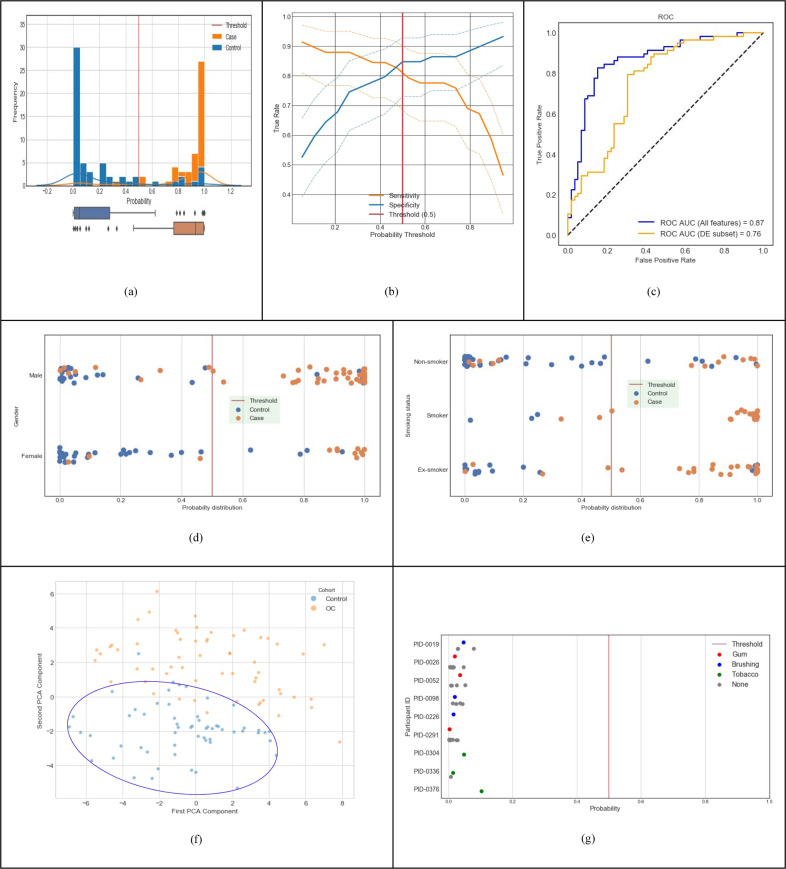
Fig. 2. Predictive performance of machine-learnt classifier trained with discovery dataset (Cohort A in Table 1).
a Distribution of classifier output probabilities across the sample set. b Sensitivity & specificity tradeoff with 95% confidence interval computed using the Clopper-Pearson method; at the default decision boundary of 0.5, sensitivity is 0.81 and specificity is 0.85. c ROC AUC of the classifier using the LOOCV method is 0.87 (blue curve); using differentially expressed features only is 0.76 (orange curve). d Classifier probabilities separated by gender. e Classifier probabilities separated by smoking status. f PCA analysis using top 100 features (PC1 and PC2 capture 10.2% and 6.3% of the total variation, respectively.). g Probability of cancer output from the classifier for control samples with and without interference from chewing gum, chewing tobacco, and brushing teeth.

