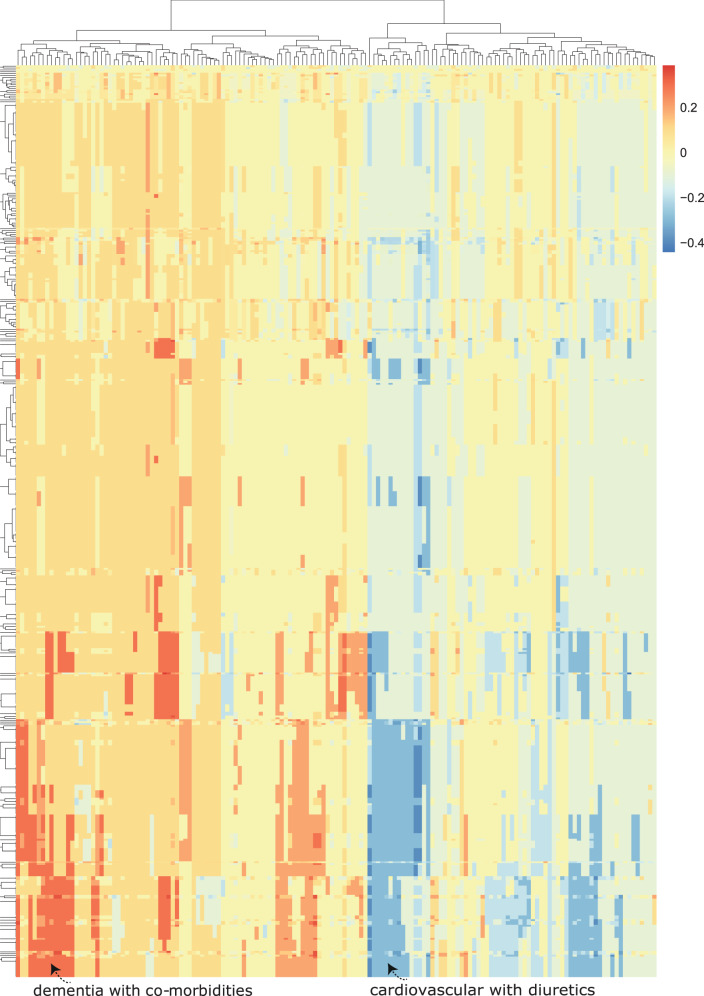
Fig. 7. Advanced class-contrastive heatmap for the deep learning model.
Class-contrastive heatmap for deep learning models showing the effect of combinations of features. Visualization of the amount of change predicted in the probability of death by setting a particular combination of two features to 1 simultaneously (versus 0). Rows represent patients and columns represent feature groupings (all combinations of two features). Predictions are made on the test set using a random forest model built on top of the autoencoder. Delirium and dementia in Alzheimer’s disease seem to predispose some patients towards greater risk of mortality (shown in the lower left region of the heatmap in red). Diuretics appear to be associated with lower mortality in a group of patients with cardiovascular disease (shown in the blue region in the lower right-hand corner of the heatmap). The heatmap also shows a hierarchical clustering dendrogram which is performed using an Euclidean distance metric and complete linkage.

