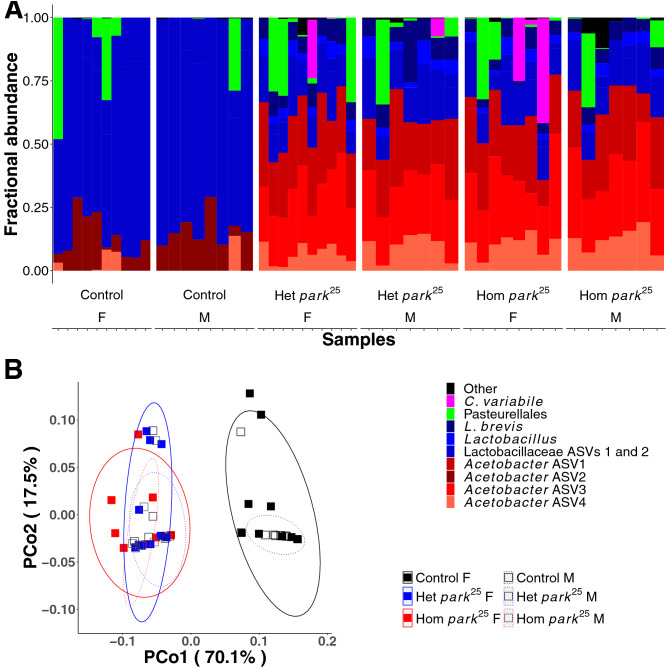
Figure 3.
The microbiota of control and park25 flies. (A) Taxon plot of control and park25 flies, separated by sex. Mutants of park25 were distinguished as homozygotes and heterozygotes based on the presence of the Tubby marker. Bars represent distinct ASVs. The legend shows the lowest taxonomic level that was assigned to each ASV. (B) Principal coordinates plot, showing the first two coordinates calculated from a weighted Unifrac distance matrix.

