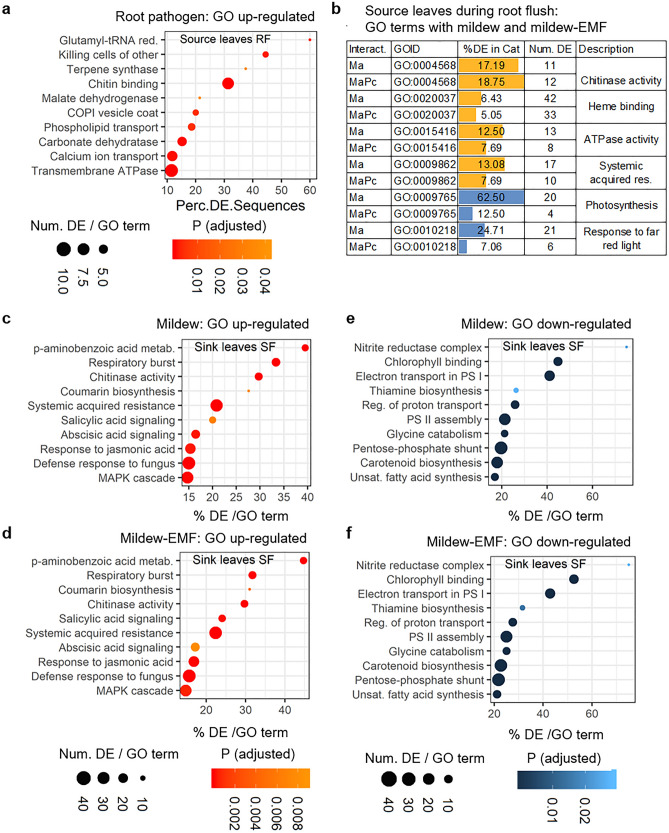
Figure 2.
Interaction type dependent changes in the enrichment of Gene Ontology terms. Gene Ontology (GO) terms enriched in up- (orange) or down-regulated (blue) genes at the adjusted significance level of FDR < 0.05 from sink leaves during shoot flush (SF) and source leaves during root flush (RF). (a) Source leaves during RF with root pathogen (Pq) Phytophthora quercina and (b) with mildew (Ma) Microsphaera alphitoides or mildew and ectomycorrhizal fungus (EMF) Piloderma croceum. (c, e) Sink leaves during SF with mildew, and (d, f), with mildew and EMF. Dot plots visualise the enrichment level as the percentage of differentially expressed genes in a GO category (dot position) and as the level of significance (dot colour). Bars visualise the enrichment level as the percentage of differentially expressed sequences in a GO category (bar length).

