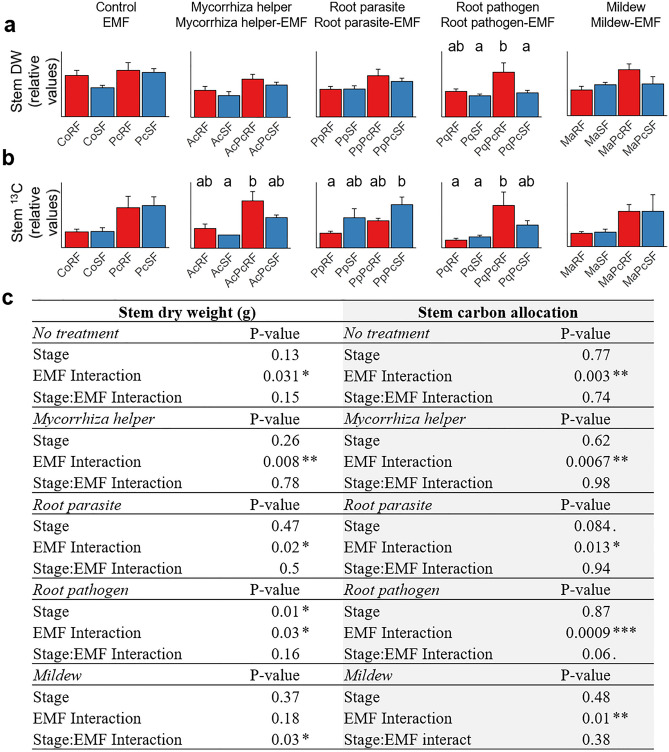
Figure 4.
Effect of the ectomycorrhizal fungus on stem biomass and carbon allocation. (a) Stem biomass (g dry weight). (b) Carbon allocation to stem (13C excess). Different letters indicate a significant difference according to linear model, ANOVA and Tukey’s test, at the significance level P < 0.05. For the purpose of simplicity, relative values are shown here, and absolute values are given in Supplementary Fig. S3. (c) Effect of the EMF on biomass partitioning to stems. Data were analysed by linear model and the relative effects and the interaction between growth stage (RF/SF) and EMF (no/yes) were assessed by using two-way ANOVA. DW, dry weight; 13C, allocation of C-13; RF, root flush; SF, shoot flush; Pc, Piloderma croceum, Ac, Streptomyces sp. AcH505; Pp, Pratylenchus penetrans, Pq, Phytophthora quercina; Ma, Microsphaera alphitoides.

