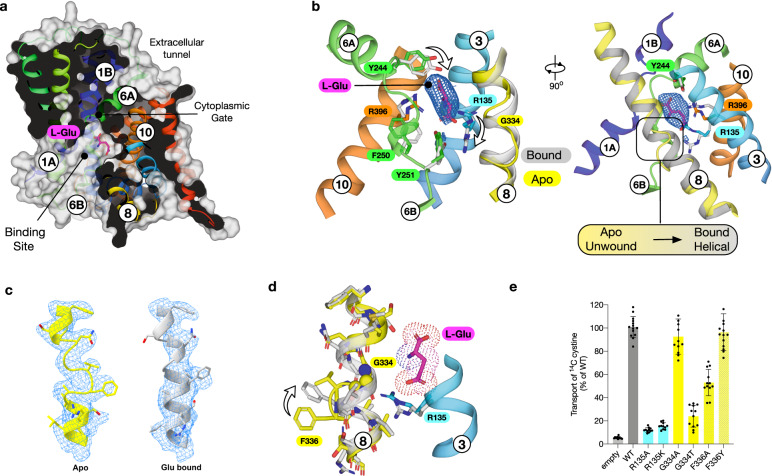
Fig. 3. l-glutamate bound structure of xCT.
a Molecular surface representation of SLC7A11 showing the bound L-Glu ligand. b Zoomed in view of the ligand binding site with differences between TM8 in the apo (coloured) and bound (grey) states. The EM density for the ligand is shown, threshold 8 sigma. c Cryo-EM density for TM8 for the apo (yellow) and l-Glu bound (grey) structures. d Structural differences on TM8 between bound and unbound forms in relation to the re-positioning of Arg135 on TM3 and subsequent repositioning of Phe336. e Transport assays of cystine uptake for cells transfected with a plasmid containing wild type or variant forms of SLC7A11 or the empty plasmid as a negative control. n = 12 independent experiments, data are presented as mean values and error bars s.d.

