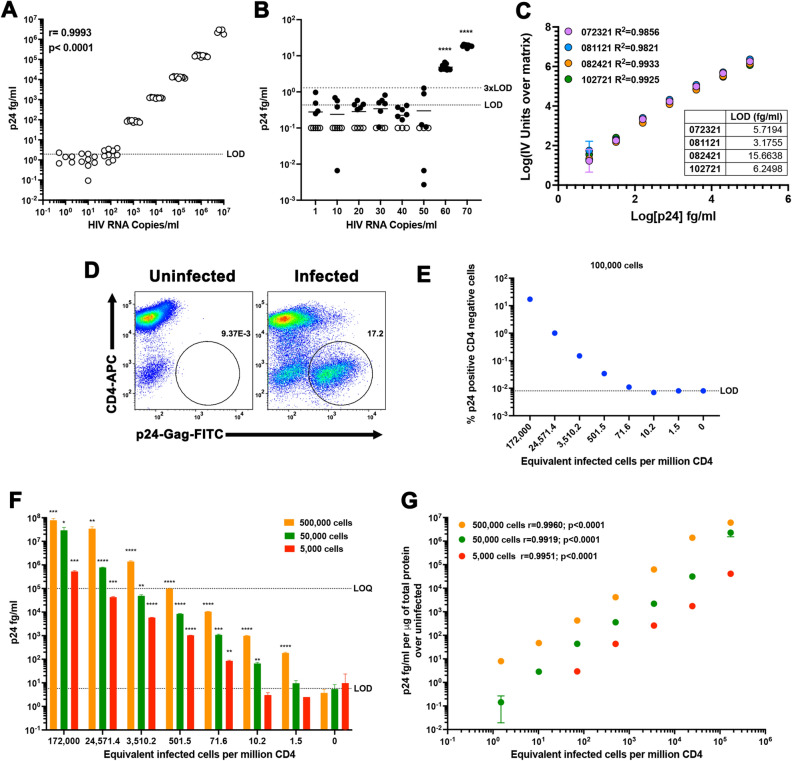
Figure 6.
Validation of the homebrew Simoa planar p24 ELISA. (A) Nine replicates of tenfold serial dilutions of a viral stock of JR-CSF were quantified using a standard curve with a range of concentrations from 100 pg/ml to 6.4 fg/ml of p24 prepared in sample diluent. Correlation was calculated using Pearson correlation. (B) Nine replicates of the indicated HIV-1 RNA copies were quantified using a standard curve with a range of concentrations from 100 pg/ml to 6.4 fg/ml of p24 prepared in sample diluent. Open symbols were identified to be below the limit of detection of the assay. One sample t test was used to calculate p values over the LOD (****< 0.0001). (C) Standard curves of 4 independent experiments using a range of concentrations from 100 pg/ml to 6.4 fg/ml of p24 prepared in NETN. Each standard was done in technical triplicates. Data has been transformed by subtracting the IV units from the matrix (0) and calculating the log10 from both the IV units and the p24 concentration. Low limit of detection (LOD) for each experiment is provided as table. (D) Primary CD4 T cells were infected with JR-CSF and levels of infection analyzed by flow cytometry. (E) Seven-fold dilution of infected cells in uninfected cells were analyzed by flow cytometry. The number of equivalent infected cells per million CD4T cells was calculated as indicated in the online Methods. (F) Lysates of each dilution corresponding to 500,000, 50,000 or 5,000 cells were quantified using a standard curve using a range of concentrations from 100 pg/ml to 6.4 fg/ml prepared in NETN buffer. Unpaired t test was used to calculate p values relative to uninfected (*< 0.05, **< 0.01; ***< 0.001, ****< 0.0001). (G) Correlation between the levels of p24 per μg of total protein and the equivalent infected cells per million CD4 was calculated using Pearson correlation.

