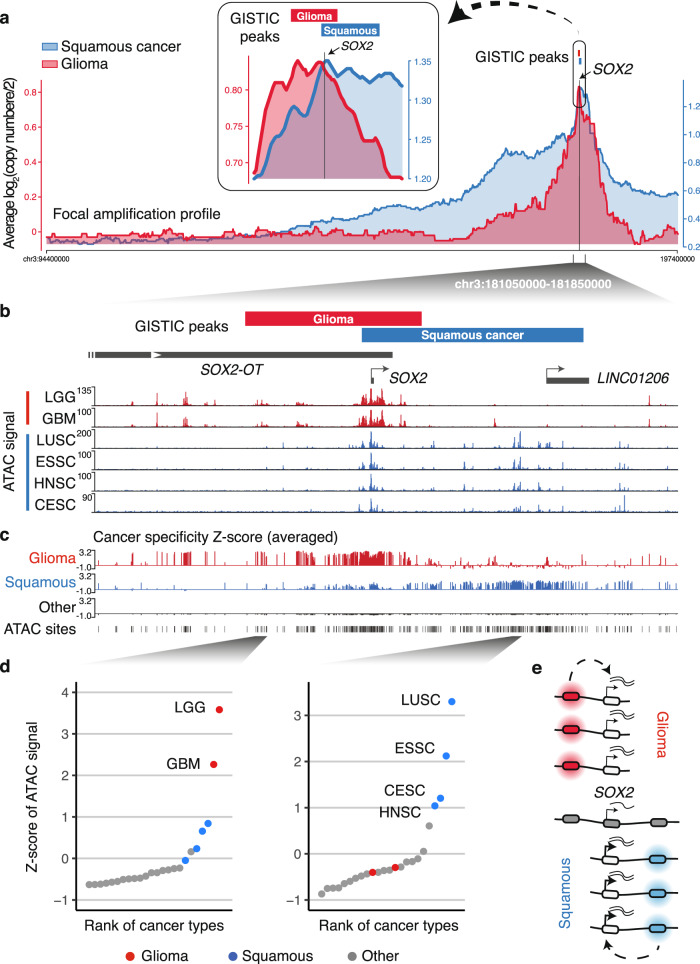
Fig. 1. Copy number amplifications of lineage-specific enhancers 5′ and 3′ to the SOX2 gene.
a GISTIC peaks for glioma and squamous cancers are presented as red and blue bars, respectively. Presented underneath the GISTIC peaks are the profiles of the averaged copy number score (log 2 (copy number/2)) for focal amplifications (<10 Mb) from samples that are associated with SOX2 amplifications (log 2 (copy number/2) > 0.1). b TCGA normalized ATAC-seq profile— averaged accessibility per 100 bp-bin across multiple samples in LGG, GBM, LUSC, ESSC, HNSC, and CESC samples. c For each of the TCGA-annotated chromatin-accessible sites, Z-scores of ATAC-seq signal were calculated across all the TCGA-profiled cancer types. The averaged Z-scores for gliomas (GBM and LGG), squamous cancers (LUSC, ESSC, HNSC, and CESC), and other cancer types are presented. d The Z-scores of ATAC-seq signal for highlighted chromatin-accessible regions across the TCGA-profiled cancer types. e Schematic illustrating that gliomas and squamous cancers may selectively amplify lineage-specific regulatory elements together with the SOX2 oncogene. Source data are provided as a Source Data file.

