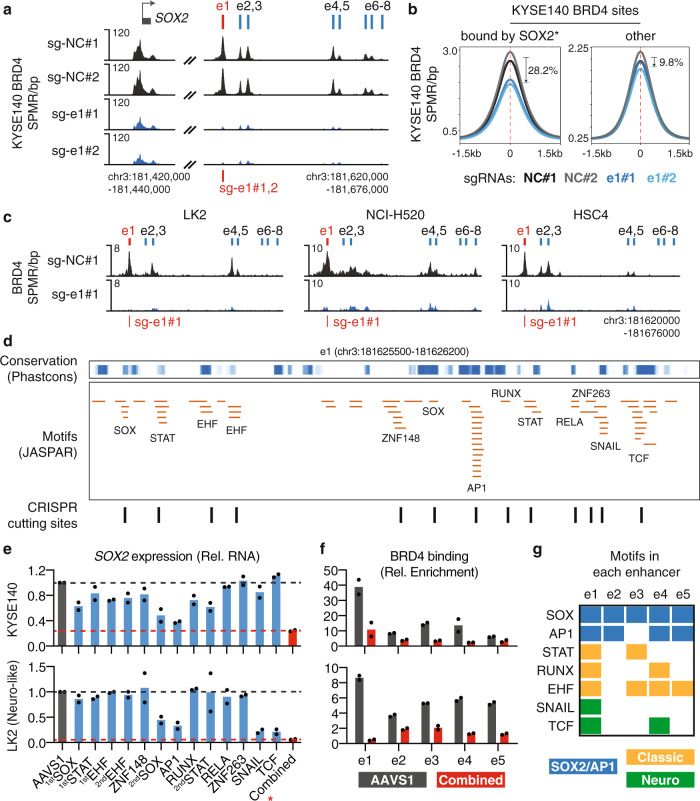
Fig. 4. The e1 enhancer drives the activity of the entire enhancer cluster.
a BRD4 ChIP-seq profile at the SOX2 locus in KYSE140 cells with and without e1 repression. b Averaged BRD4 ChIP-seq profile, across BRD4 sites that harbor high-confidence SOX2 binding (*SOX2 ChIP-seq peaks containing SOX motifs) or the other BRD4 sites, in KYSE140 cells with and without e1 repression. c BRD4 ChIP-seq profile at the e1–e8 locus in LK2, NCI-H520, and HSC4 cells with and without e1 repression. d Top: PhastCons scores (0:1 range) representing the conservation level of DNA sequences in the e1 enhancer. Middle: distribution of JASPAR DNA motifs identified in the e1 enhancer. Bottom: CRISPR cutting sites that overlap with the identified DNA motifs. e RT-qPCR measuring expression changes of SOX2 in KYSE140 and LK2 cells after CRISPR-mediated disruption of each of the identified DNA motifs. The expression level was normalized to the sgAAVS1 control. n = 2 biologically independent experiments. *: combinatorial CRISPR cutting of SOX (2nd), AP1, RUNX, and STAT (2nd) motifs in KYSE140 cells, or SOX (2nd), AP1, SNAIL, and TCF motifs in LK2 cells. f ChIP-qPCR showing the relative enrichment of BRD4 at e1–e5 in KYSE140 and LK2 cells after combinatorial CRISPR cutting of the selected motifs. ChIP enrichment was normalized to DNA concentration of each sample (measured by Qubit) and then to sonicated genomic input. n = 2 biologically independent experiments. g Presence of the candidate functional motifs in the e1–e5 enhancers. Source data are provided as a Source Data file.

