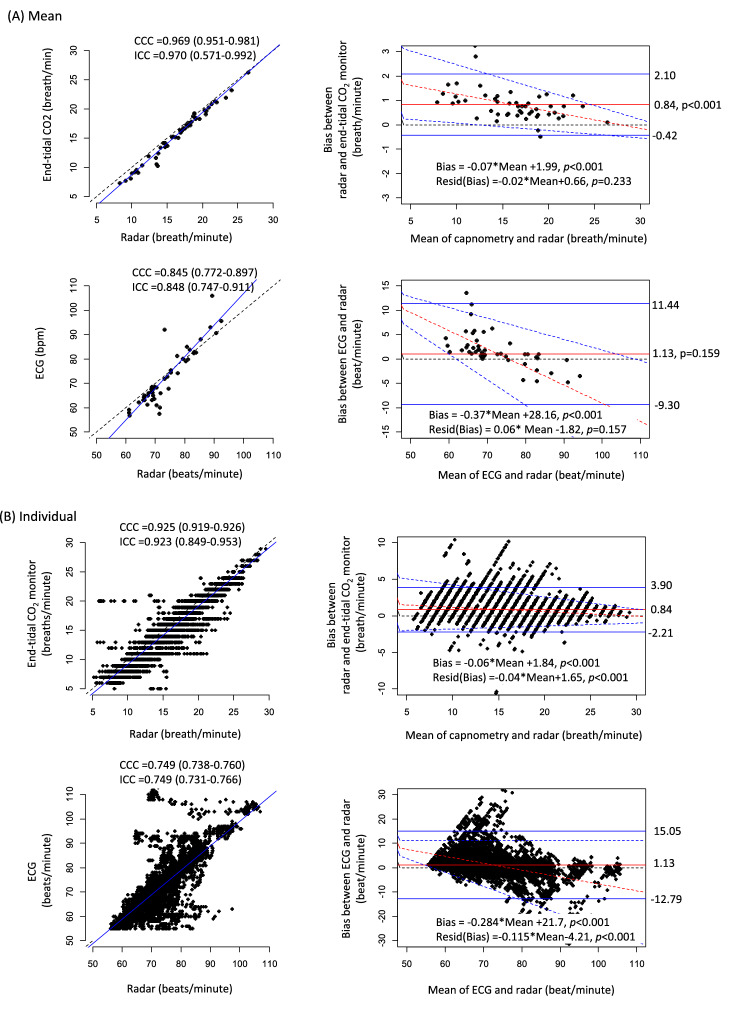
Figure 4.
Agreements between RRs and HRs measured using IR-UWB radar and those measured using the conventional patient monitor. (A) Agreements of mean RR and HR. (B) Agreements of individual RR and HR. The blue solid lines in scatter plots indicates estimates of linear regression models. The blue solid lines in Bland–Altman plots indicate 95% upper and lower LOAs and the red solid lines indicate the mean biases. The red broken lines represent the estimates of linear regression models between the bias and the mean values and the blue broken lines represent the 95% prediction intervals of the biases corresponding to the mean values. Resid(Bias) residuals of biases between radar and the conventional monitors.

