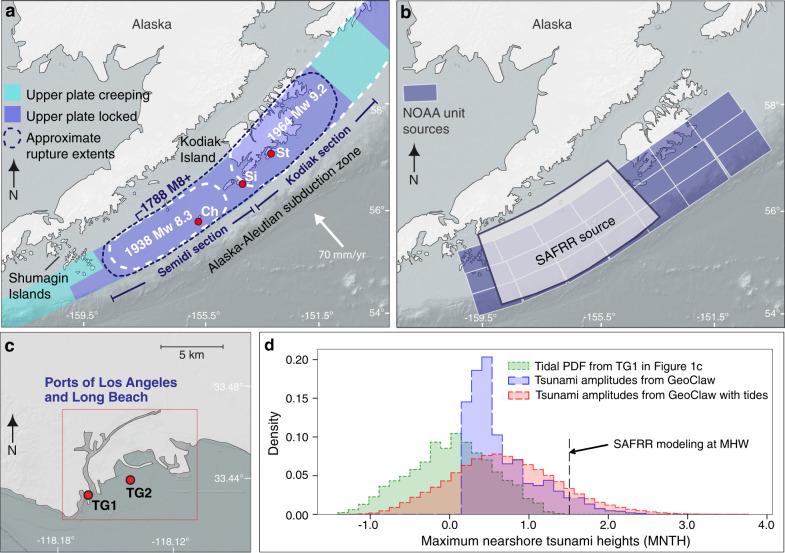
Fig. 1. Alaska-Aleutian subduction zone tectonic setting and distant-source tsunami modeling.
a Plate tectonic setting of Alaska showing the locked and creeping sections of the Alaska-Aleutian subduction zone, earthquake section boundaries, and approximate historical earthquake extents. Red circles show sites with paleoseismic evidence supporting multi-section earthquake ruptures. Ch Chirikof Island, Si Sitkinak Island, St Sitkalidak Island. b Light gray shaded area shows the approximate extent of slip used in the U.S. Geological Survey (USGS) Science Application for Risk Reduction (SAFRR) scenario magnitude 9.1 Semidi section earthquake underlain by a grid of the NOAA unit sources used in this paper. c Map of the Ports of Los Angeles and Long Beach showing the location of the long-term tide gauge (est. 1923) measuring water levels at the ports (TG167) and the synthetic tide gauge (TG2) where maximum nearshore tsunami heights (MNTH) were measured in this study. d Plot showing the probability density function (PDF) of the MNTH from our suite of modeled earthquake magnitudes in the year 2000 with no tidal variability included (blue histogram), the PDF of the tidal variability at TG1 (green histogram), and the combined MNTH and tidal variability PDF (red histogram). The dashed line shows the 1-m amplitude SAFRR scenario tsunami striking at high tide (MHW)16, resulting in a MNTH of 1.5 m at the ports.

