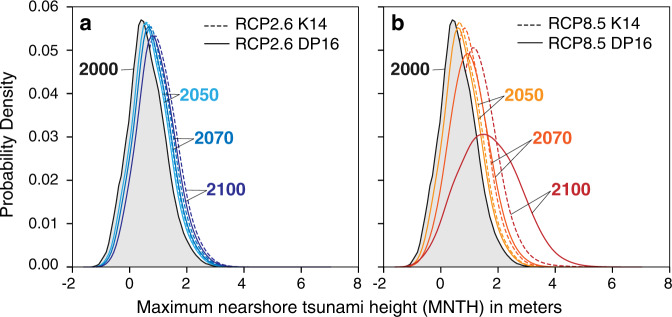
Fig. 3. Normalized distributions of maximum nearshore tsunami heights (MNTH) at the Ports of Los Angeles and Long Beach.
The MNTH distribution for 2000 reflects the range of possible modeled MNTH, including tidal variability and does not include sea-level rise. MNTH distributions for 2050, 2070, and 2100 are calculated by combining the same range of modeled MNTH with a low-emissions (RCP2.6) sea-level projections with the K1468 Antarctic Ice Sheet (AIS) contribution and DP1660 AIS contribution. b high-emissions (RCP8.5) sea-level projections with K1468 AIS contribution and DP1660 AIS contribution.

