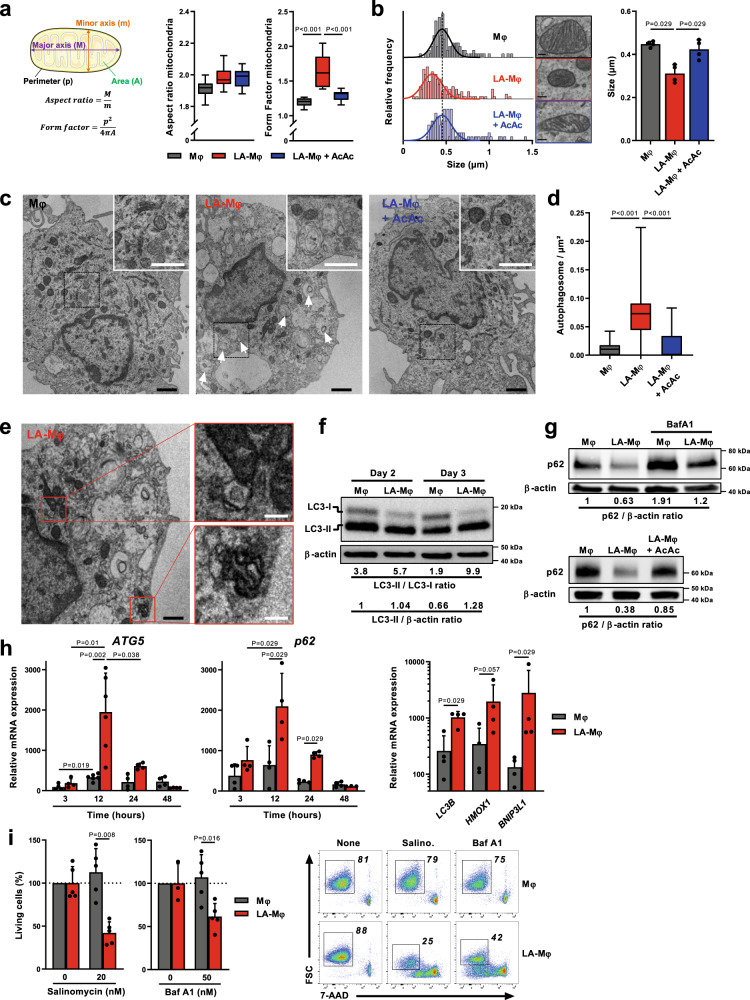
Fig. 2. Human macrophages display upregulation of autophagic flux during lactic acidosis.
a–i Monocytes were polarized without lactic acid (Mφ), with lactic acid (LA-Mφ) or with lactic acid and acetoacetate (LA-Mφ + AcAc). a Schematic representation of the morphological meaning of aspect ratio and form factor indexes (left) and analyses of these indexes by confocal microscopy in macrophages at day 5 (right) (n = 10 cells examined over 2 independent replicates). b Size of mitochondria measured on TEM micrographs at day 3. Left panel, representative frequency histograms (size bar, 0.1 µm); right panel, a compilation of the results (mean ± SD; n = 100–150 mitochondria examined over 4 independent replicates). c Representative TEM micrographs of the indicated Mφ subsets on day 3 (representative images shown from three independent biological experiments); arrows, autophagosomes; black size bar, 1 µm; white size bar (insert), 0.3 µm. d Quantification of autophagic vesicles per cell on day 3 (n = 30 cells examined over 3 biological replicates). e Representative TEM micrographs of mitophagy vacuoles in day 3 LA-Mφ (representative images shown from three independent biological experiments); black size bar, 1 µm; white size bar (insert), 0.3 µm. f, g Western blotting analysis of LC3-I, LC3-II (f), p62 (g), and β-actin (f–g) in day 3 Mφ, in the presence or absence of bafilomycin A1 (BafA1) or AcAc. The LC3-II/LC3-I, LC3-II/β-actin, and p62/β-actin band intensity ratios are indicated (representative images shown from three independent experiments). h Levels of ATG5, p62, LC3B, HMOX1, and BNIP3L1 mRNA were assessed by RT-qPCR at the indicated time points (left and middle panels) and at 12 h (right panel) and were normalized to the expression of the RPS18 housekeeping gene (n = 4). i Day 2 Mφ was exposed to salinomycin or BafA1 for 24 h, and cell viability was evaluated by flow cytometry with 7-AAD staining (n = 5, left panel). Results are expressed as percent viability compared to the Mφ condition, which has been assigned a value of 100%. Representative dot plots showing 7-AAD staining versus FSC (right panel). a–i The boxplots display a median line, interquartile range (IQR) boxes, min to max whiskers; a two-tailed Mann–Whitney U test was performed for statistical analysis. Source data are provided in a Source Data file.

