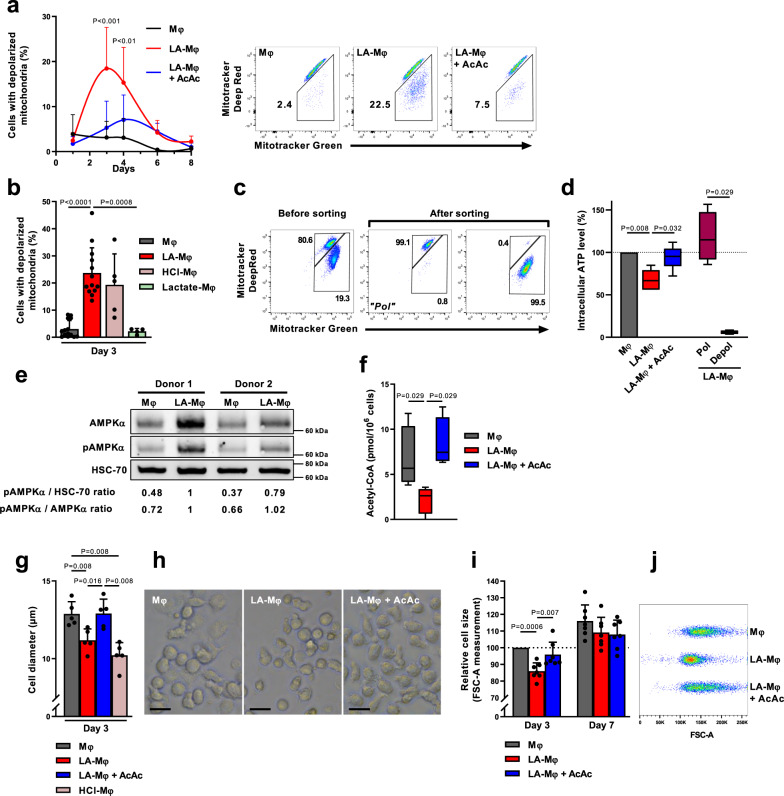
Fig. 3. Macrophages in conditions of lactic acidosis display mitochondrial depolarization and characteristics typical of starving cells.
a–k Monocytes were polarized into macrophages in the absence (Mφ) or presence of lactic acid (LA-Mφ), lactic acid and acetoacetate (LA-Mφ + AcAc), sodium lactate (Lactate-Mφ), or under acidosis (HCl-Mφ). a, b Cells with depolarized mitochondrial membrane potential (ΔΨm) were analyzed by flow cytometry using MitoTracker Green and MitoTracker Deep Red probes at the indicated time point (a) (mean ± SD; n = 4, two-way ANOVA followed by a Tukey post hoc test was performed for statistical analysis) or at day 3 (b) (mean ± SD; n = 14 for Mφ; n = 13 for LA-Mφ; n = 5 for HCl-Mφ; n = 4 for Lactate-Mφ). Representative dot plots on day 3 (a, right panel). c Macrophages with or without depolarized mitochondrial membrane potential (“Depol” and “Pol” populations, respectively) were isolated from day 3 LA-Mφ by flow cytometry with MitoTracker Green and MitoTracker Deep Red probes. Purity was >99%. d Intracellular ATP levels were measured in a semiquantitative assay. The results were normalized against the Mφ condition for each donor (n = 5). e Levels of total AMPKα, AMPKα phosphorylated on Thr172 (pAMPKα) and HSC-70 were analyzed by Western blotting at 6 h (representative images from four independent experiments); the values correspond to pAMPKα/HSC-70 and pAMPKα/AMPKα band intensity ratios. f Intracellular acetyl-CoA levels determined on day 3 (n = 4). g–j Cell size was measured on day 3 (g–j) and day 7 (i), by determining the mean ± SD of the diameter of Mφ in each population (g, n = 5) or relative cell size by flow cytometry with the FSC-A parameter (i, n = 7). h Photomicrographs of the Mφ population on day 3 (representative images from five independent experiments); size bar, 10 µm. j Representative dot plots from one donor of FSC-A measurement. a–j The boxplots display a median line, interquartile range (IQR) boxes, min to max whiskers; a two-tailed Mann–Whitney U test was performed for statistical analysis unless specified otherwise. Source data are provided in a Source Data file.

