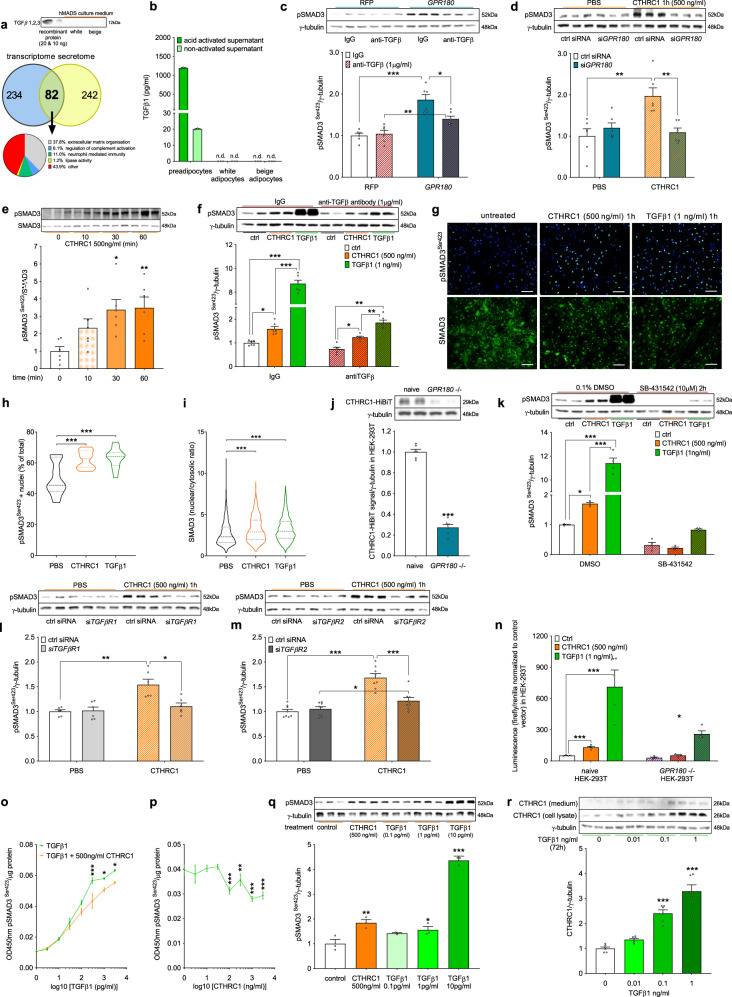
Fig. 4. CTHRC1 induces SMAD3 phosphorylation via GPR180.
a Immunostaining of TGFβ proteins in conditioned media of white and beige hMADS adipocytes with recombinant TGFβ as a positive control and identification of secreted proteins by hMADS adipocytes. b TGFβ1 levels in conditioned media of preadipocytes and mature white and beige hMADS adipocytes (n = 3). c Representative blots and quantification of SMAD3 phosphorylation in white adipocytes overexpressing GPR180 while treated with TGFβ neutralizing antibody (n = 6; p < 0.0001 for RFP IgG vs GPR180 IgG; p = 0.0064 for GPR180 IgG vs GPR180 anti-TGFβ and p = 0.0408 for RFP anti-TGFβ vs GPR180 anti-TGFβ). d SMAD3 phosphorylation in beige adipocytes following CTHRC1 treatment in combination with GPR180 ablation (n = 6; p = 0.0012 for PBS ctrl siRNA vs CTHRC1 ctrl siRNA and p = 0.0030 for CTHRC1 ctrl siRNA vs CTHRC1 siGPR180). e Time-dependent effect of acute CTHRC1 stimulus on SMAD3 phosphorylation after the adipocytes were starved for 2 h (n = 6; p = 0.0103 for 30 min and p = 0.0073 for 60 min). f Effect of CTHRC1 and TGFβ1 treatment (1 h) on SMAD3 phosphorylation in beige hMADS cells in presence of IgG and neutralizing anti-TGFβ antibody (n = 6; p = 0.0133 ctrl vs CTHRC1 within IgG, p < 0.0001 ctrl vs TGFβ1 within IgG, p < 0.0001 CTHRC1 vs TGFβ1 within IgG, p = 0.0442 ctrl vs CTHRC1 within anti-TGFβ, p < 0.0001 ctrl vs TGFβ1 within anti-TGFβ and p = 0.0095 CTHRC1 vs TGFβ1 within anti-TGFβ). g Representative images with scale bar 100 µm and quantification of h phosphorylated SMAD3 (green) positive nuclei (blue) (n = 15; p = 0.0002 for CTHRC1 and p < 0.0001 for TGFβ1) and i total SMAD3 (green) shuttling in response to CTHRC1 and TGFβ1 (n = 1400; p < 0.0001 for both CTHRC1 and TGFβ1). Experiment was repeated independently twice with similar results. j Representative western blots and quantification of the binding of CTHRC1 tagged with HiBiT in control and stable GPR180 knockout HEK-293T cells (n = 6; p < 0.0001). k Effect of CTHRC1 stimulus (1 h) on SMAD3 phosphorylation in TGFβR1 kinase inhibitor pre-treated cells (n = 4; p = 0.0356 for CTHRC1, p < 0.0001 for TGFβ1 and p < 0.0001 for CTHRC1 vs TGFβ1 within DMSO). SMAD3 phosphorylation in response to CTHRC1 in combination with silencing of l TGFβR1 (n = 6; p = 0.0053 for PBS ctrl siRNA vs CTHRC1 ctrl siRNA, p = 0.0137 for CTHRC1 ctrl siRNA vs CTHRC1 siTGFβR1) and m TGFβR2 (n = 8; p < 0.0001 for PBS ctrl siRNA vs CTHRC1 ctrl siRNA, p < 0.0001 for CTHRC1 ctrl siRNA vs CTHRC1 siTGFβR2 and p = 0.0275 for PBS siTGFβR2 vs CTHRC1 siTGFβR2) in human beige adipocytes. n Luciferase activity in naïve and GPR180 knockout HEK-293T cells transfected with plasmid expressing 4× SMAD binding elements (SBE) upstream of luciferase in response to CTHRC1 and TGFβ1 stimulus for 18 h (n = 4; p < 0.0001 for both treatments in naïve HEK-293T cells and p = 0.0261 for TGFβ1 in GPR180 ablated HEK293Ts cells). o SMAD3 phosphorylation in beige hMADS cells treated with different concentrations of TGFβ1 in combination with CTHRC1 (n = 3; p < 0.0001 for 300 ng/ml, p = 0.0362 for 100 ng/ml and p = 0.0177 for 3000 ng/ml). p SMAD3 phosphorylation in response to TGFβ1 (300 pg/ml) in combination with increasing dose of CTHRC1 (n = 3; p = 0.0003 for 100 ng/ml, p = 0.0099 for 300 ng/ml, p < 0.0001 for 1000 ng/ml and p = 0.0004 for 3000 ng/ml). q Phosphorylation of SMAD3 in response to CTHRC1 and TGFβ1 (n = 3; CTHRC1 p = 0.0021, TGFβ 1 pg/ml p = 0.0281 and 10 pg/ml p < 0.0001). r Regulation of CTHRC1 in beige adipocytes following TGFβ1 treatment (n = 6; p < 0.0001 for both 0.1 and 1 ng/ml). Data are shown as average ±SEM. Statistical analysis was performed by two-sided Student’s t-test (j, o, p), one-way (e, h, i, q, r) or two-way ANOVA (c, d, f, k–m) with Dunnett’s or Tukey post-hoc test, respectively. Significant difference is indicated as *p < 0.05, **p < 0.01 and ***p < 0.001. CTHRC1 Collagen triple helix repeat containing 1, DMSO dimethyl sulfoxide, GPR180 G protein-coupled receptor 180, hMADS human multipotent adipose-derived stem cells, IgG immunoglobulin G, n.d. not detected, PBS phosphate buffered saline, RFP red fluorescent protein, SMAD3 Mothers against decapentaplegic homolog 3, TGFβ1 Transforming growth factor β1, TGFβR1 Transforming growth factor β receptor type 1, TGFβR2 Transforming growth factor β receptor type 2.

