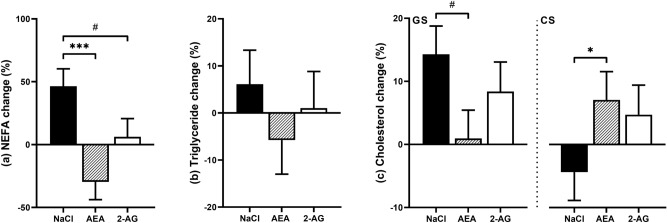
Figure 2.
Percent changes (%) in plasma NEFA (a), triglyceride (TG) (b) and cholesterol (c) concentrations after i.p. injections of NaCl (n = 7), AEA (n = 7) or 2-AG (n = 6) for 8 days relative to pre-treatment. Plasma NEFA concentatrions significantly decreased after 8 days of treatment with AEA compared to the control group (P < 0.001) and tended to increase to a lesser extend with 2-AG treatment compared to the control group (P = 0.05). No changes were detected for percent changes in plasma TG. Plasma cholesterol percent changes differed in the control group between diets, as indicated by the treatment x diet interaction (P < 0.05). Graphs are presented as highest level of significant interaction, associated P-values can be found in Supplementary Table S3. Treatment differences are indicated by # < 0.1, * P < 0.05 and *** P < 0.001 (Tukey–Kramer).

