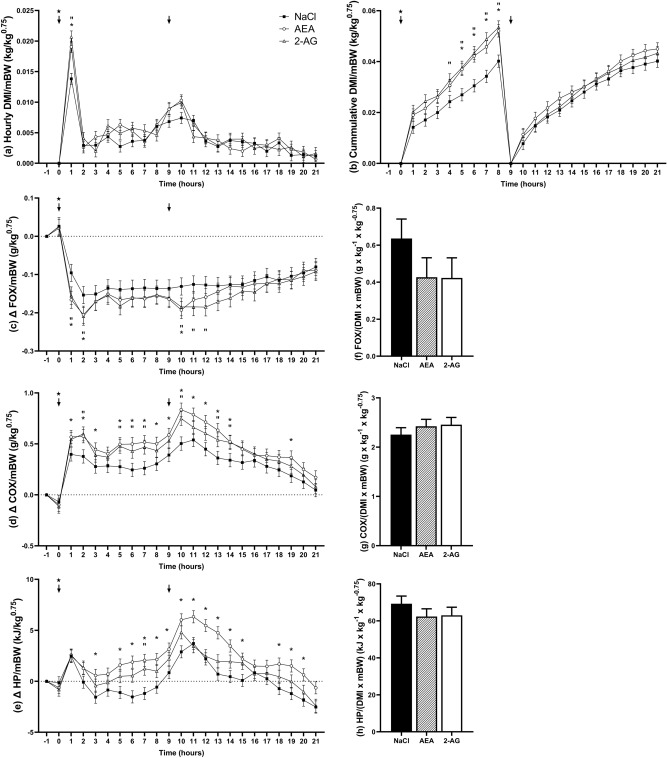
Figure 3.
Hourly dry matter intake (DMI) per mBW (a), cumulative DMI/mBW (b), changes in fat oxidation per mBW (Δ FOX/mBW) (c), changes in carbohydrate oxidation per mBW (Δ COX/mBW) (d), changes in heat production per mBW (Δ HP/mBW) (e) and daily fat oxidation (FOX) (f), carbohydrate oxidation (COX) (g) and heat production (HP) (h), each normalized to dry matter intake (DMI) and metabolic bodyweight (mBW). Cows were intraperitoneally injected with either NaCl (n = 7), AEA (n = 7) or 2-AG (n = 6). Feed was withheld from 07:00 to 08:00 a.m. The star indicates the i.p. injection (08:00 a.m.), the arrow indicates feeding at 08:00 a.m. and 05:00 p.m. Graphs are presented as highest level of significant interaction, associated P-values can be found in Supplementary Table S3. Treatment differences between the control and AEA group are indicated by * (P < 0.05; Tukey–Kramer), and differences between the control and 2-AG group are indicated by “(P < 0.05; Tukey–Kramer).

