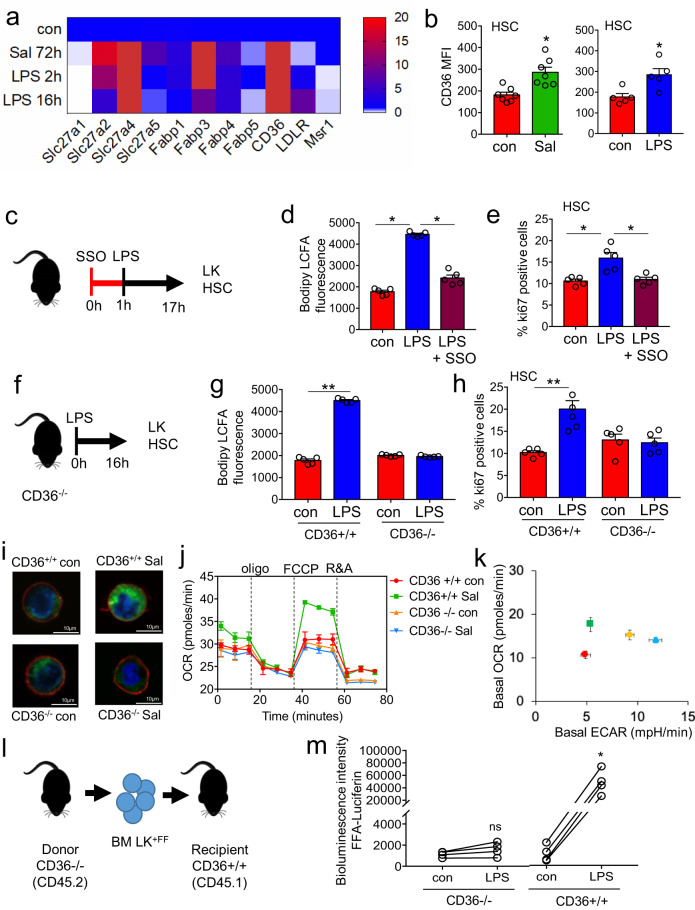
Fig. 4. CD36 regulates long-chain free fatty-acid uptake in HSC in response to infection.
a Heat map of fatty-acid transporter genes differentially expressed by HSCs from control, S. typhimurium (Sal), and LPS-treated animals. b Flow cytometry analysis of CD36 expression in the HSC of S. typhimurium and LPS-treated animals. n = 5 in each group. c C57BL/6 J mice were pre-treated with SSO for one hour before treatment with LPS for 16 hours. n = 5 in each group. d The cells from control, LPS, or LPS and SSO-treated animals were isolated and long-chain fatty-acid (LCFA) uptake was measured using the QBT assay. n = 5 in each group. e Percentage of cycling HSCs as measured by Ki67-positive cells after pre-treatment followed by LPS treatment. n = 5. f Schematic diagram of the experiment. g The LK cells from LPS-treated CD36−/− or WT (CD36+/+) mice were isolated and long-chain fatty-acid (LCFA) uptake was measured using the QBT assay. n = 5. h Percentage of cycling HSCs from LPS-treated CD36−/− or WT (CD36+/+) mice as measured by Ki67-positive. n = 5 mice in each group. i CD36−/− or WT (CD36+/+) were infected with S. typhimurium (Sal). Representative live-cell fluorescent microscopy images of LSK cells isolated from the mice, Sca1 membrane stain (red), Bodipy 493/503 (green) and Hoechst 33342 (blue), 20 LSK cells from five mice in each condition. j CD36+/+ and CD36−/− mice were treated with S. typhimurium the animals were killed and the LSK population was isolated by FACS, OCR was measured. n = 5. k Basal ECAR compared to basal OCR levels before and after treatment with LPS or S. typhimurium. Basal OCR normalized to rotenone. n = 5. l Schematic diagram of experimental design. m Mice were injected LPS for 16 hours then treated with FFA-SS-luc and imaged using bioluminescence (FFA-luciferin+LPS). Densitometry of the bioluminescent images to determine fluorescence intensity. n = 4 for each group. The Mann–Whitney U test (two-tailed) was used and the Kruskal–Wallis test followed by Dunn’s multiple comparison post hoc test was used *P < 0.05 **p < 0. 01. Source data are provided as a Source Data file.

