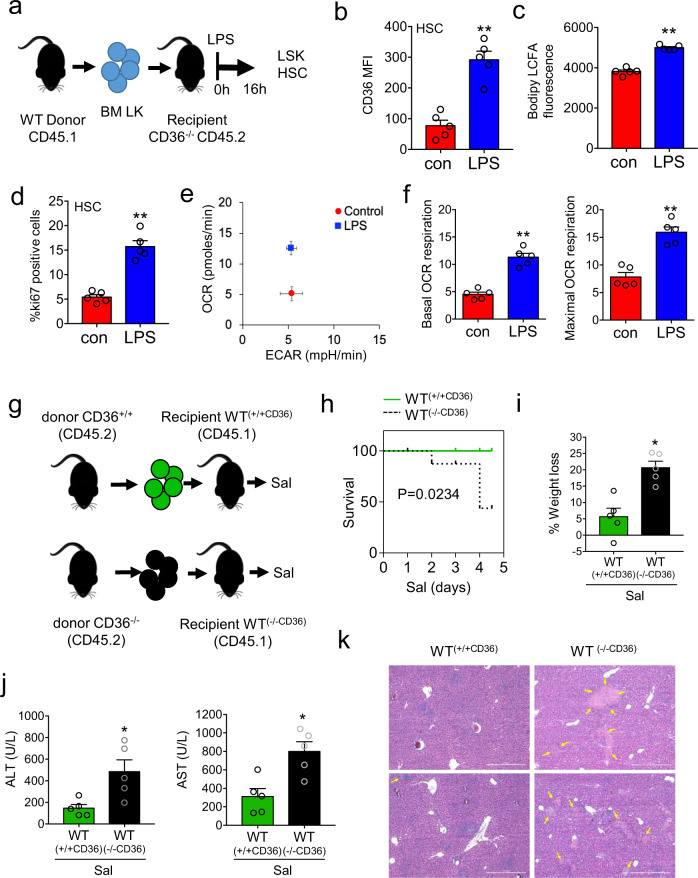
Fig. 5. FFA uptake through CD36 is an essential component of HSC expansion in response to infection.
a Schematic diagram of experimental design. CD36+/+ CD45.1 lineage negative, CD117-positive cells were isolated and transplanted into CD36−/− CD45.2 animals. Post engraftment mice were treated with 1 mg/kg LPS for 16 hours and the bone marrow cells were analyzed by flow cytometry. b Flow cytometry analysis of CD36 expression (CD36 mean fluorescence intensity (MFI)) in the HSC from the transplant mice following 1 mg/kg LPS (16 hours) treatment. n = 5 mice in each group. c The LK cells were isolated and long-chain fatty-acid (LCFA) uptake was measured using the QBT assay. n = 5 in each group. d Percentage of cycling HSCs as measured by Ki67-positive cells from transplant mice after 16 hours of 1 mg/kg LPS treatment. n = 5 mice in each group. e The LSK population was isolated by FACS, oxygen consumption rate (OCR) was measured by the extracellular flux assay. Basal extracellular acidification rate (ECAR) compared with basal OCR levels provides a snapshot of the bioenergetic profile of LSK before and after treatment with LPS (16 hours). Basal OCR normalized to rotenone. n = 5 mice in each group. f Basal (normalized to rotenone) and maximal mitochondrial respiration in LSK cells from control vs. LPS 16 hours treated transplanted mice. n = 5 mice in each group. g CD36+/+ CD45.2 or CD36−/− CD45.2 lineage negative, CD117-positive cells were isolated and transplanted into WT CD45.1 mice these were termed WT(+/+CD36) or WT(−/−CD36). Post engraftment mice were treated with S. typhimurium for 96 hours. h Kaplan–Meier survival curve n > 5 mice in each group. i Weight loss was analyzed. n = 5 in each group. j Levels of circulating alanine aminotransferase (ALT) and aspartate aminotransferase (AST) in the serum following 96 hours of S. typhimurium treatment. n > 5 in each group. k Livers were isolated and sectioned and stained with hematoxylin and eosin. (Magnification: H, ×63). n = 5 mice in each group. Data shown are means ± SD. The Mann–Whitney U test (two-tailed) was used to compare between treatment groups *p < 0.05 **p < 0.01. Source data are provided as a Source Data file.

