
FIGURE 3.
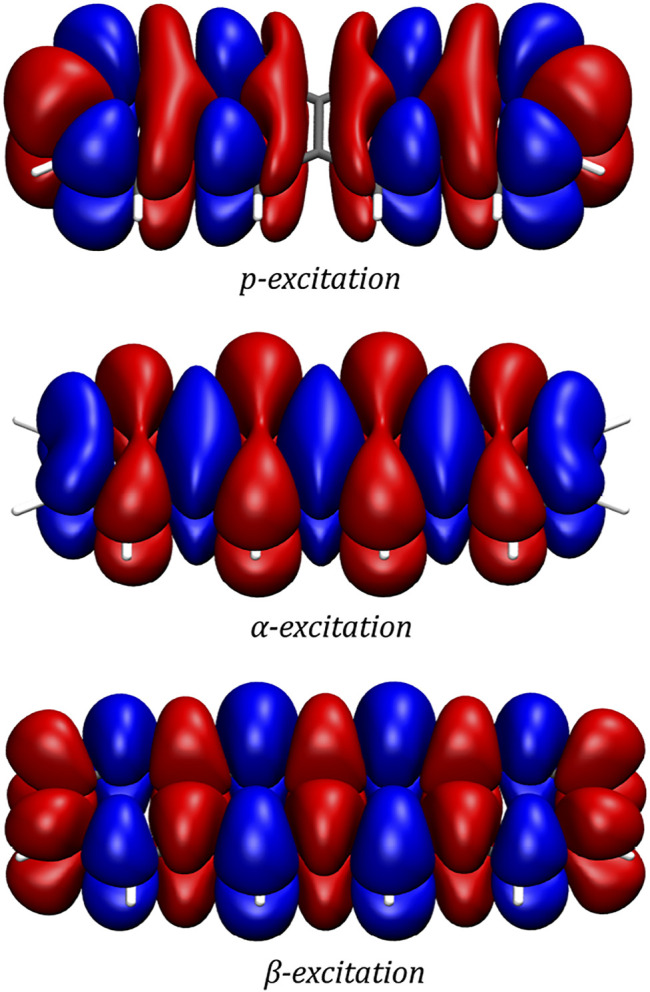
Transition densities of the p-, α- and β-excitations as generated by a two-component CD-evGW/BSE@CAM-B3LYP calculation. The plots were generated with VMD using an isovalue of 0.0001 for the p-excitation and 0.0002 for the α- and β-excitations. The colour blue indicates a loss while red indicates a gain of electron density.