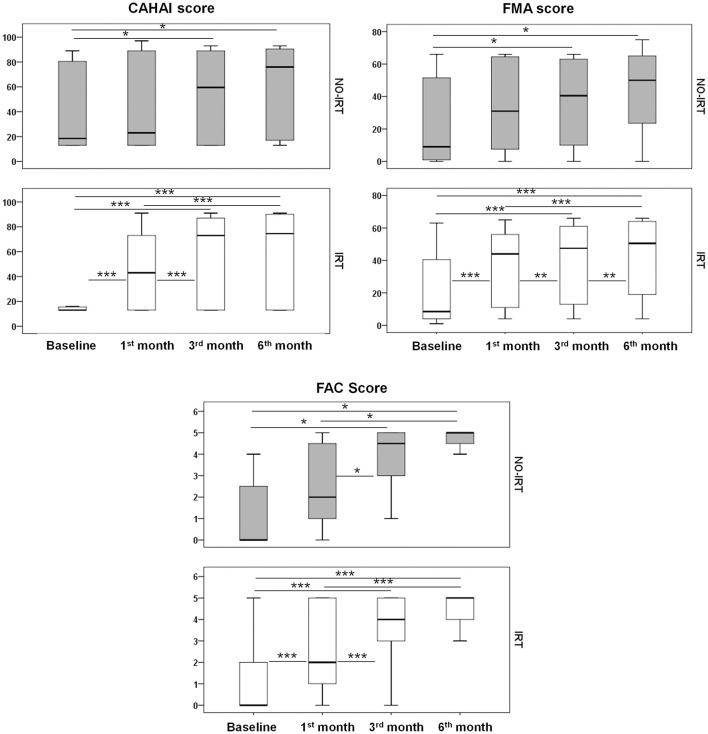
Figure 2.
Functional outcome. Temporal profile of the tested scales in IRT and NO-IRT cohorts. Note that in the 1st month significant improvements were only achieved in the IRT group. Differences were assessed with the Wilcoxon tests and the Man-Withney U for the transversal analysis. *p < 0.05; **p < 0.01, and ***p < 0.001. Median and IQR are represented in box plots.

