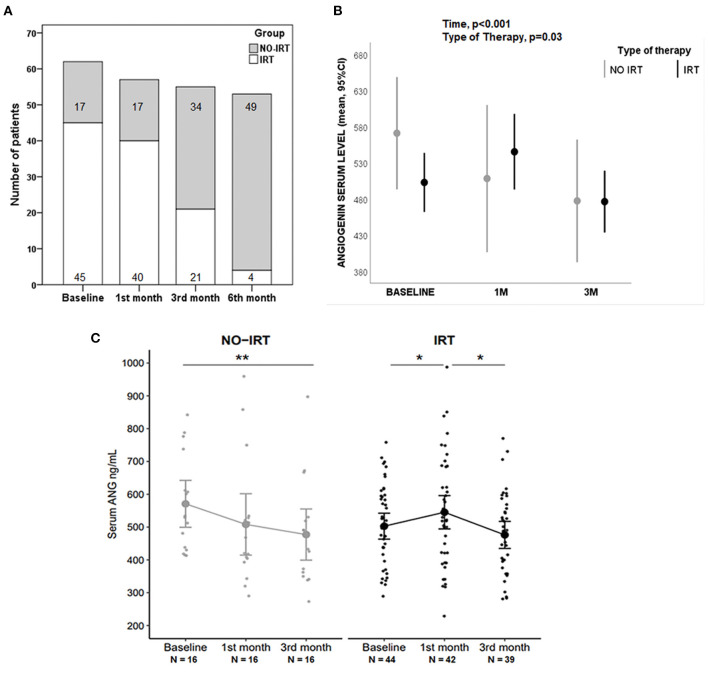
Figure 3.
Angiogenin (ANG) blood levels during rehabilitation. (A) Bar graph showing the number of patients under IRT and NO-IRT over time, changing according to early improvements in the IRT group. (B) Graph comparing how time and type of therapy influenced the serum levels of ANG, assessed with ANOVA for repeated measures. (C) Jitter plots showing the temporal profile of ANG levels in NO-IRT and IRT groups; Differences were assessed with Wilcoxon tests, *p < 0.05, **p < 0.01. Mean with 95% CI are represented in graphs.

